
Page 149 - Geotechnical Engineering Soil and Foundation Principles and Practice
P. 149
Particle Size and Gradation
144 Geotechnical Engineering
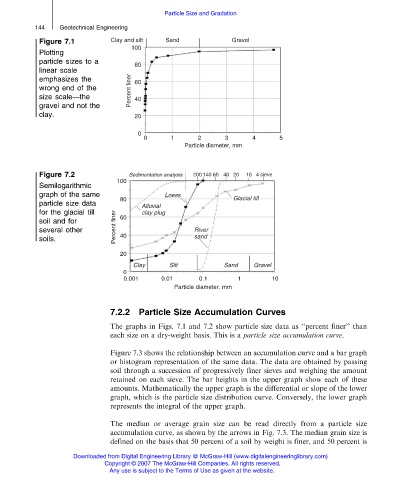
Figure 7.1
Plotting
particle sizes to a
linear scale
emphasizes the
wrong end of the
size scale—the
gravel and not the
clay.
Figure 7.2
Semilogarithmic
graph of the same
particle size data
for the glacial till
soil and for
several other
soils.
7.2.2 Particle Size Accumulation Curves
The graphs in Figs. 7.1 and 7.2 show particle size data as ‘‘percent finer’’ than
each size on a dry-weight basis. This is a particle size accumulation curve.
Figure 7.3 shows the relationship between an accumulation curve and a bar graph
or histogram representation of the same data. The data are obtained by passing
soil through a succession of progressively finer sieves and weighing the amount
retained on each sieve. The bar heights in the upper graph show each of these
amounts. Mathematically the upper graph is the differential or slope of the lower
graph, which is the particle size distribution curve. Conversely, the lower graph
represents the integral of the upper graph.
The median or average grain size can be read directly from a particle size
accumulation curve, as shown by the arrows in Fig. 7.3. The median grain size is
defined on the basis that 50 percent of a soil by weight is finer, and 50 percent is
Downloaded from Digital Engineering Library @ McGraw-Hill (www.digitalengineeringlibrary.com)
Copyright © 2007 The McGraw-Hill Companies. All rights reserved.
Any use is subject to the Terms of Use as given at the website.