
Page 150 - Geotechnical Engineering Soil and Foundation Principles and Practice
P. 150
Particle Size and Gradation
Particle Size and Gradation 145
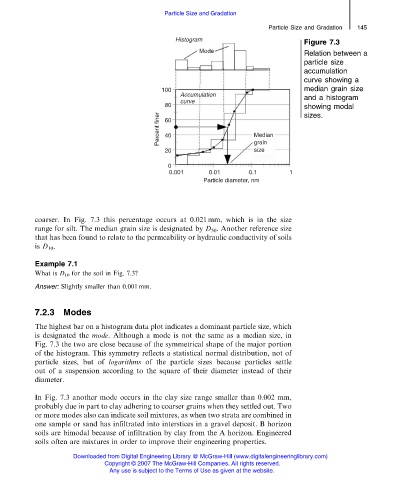
Figure 7.3
Relation between a
particle size
accumulation
curve showing a
median grain size
and a histogram
showing modal
sizes.
coarser. In Fig. 7.3 this percentage occurs at 0.021 mm, which is in the size
range for silt. The median grain size is designated by D 50 . Another reference size
that has been found to relate to the permeability or hydraulic conductivity of soils
is D 10 .
Example 7.1
What is D 10 for the soil in Fig. 7.3?
Answer: Slightly smaller than 0.001 mm.
7.2.3 Modes
The highest bar on a histogram data plot indicates a dominant particle size, which
is designated the mode. Although a mode is not the same as a median size, in
Fig. 7.3 the two are close because of the symmetrical shape of the major portion
of the histogram. This symmetry reflects a statistical normal distribution, not of
particle sizes, but of logarithms of the particle sizes because particles settle
out of a suspension according to the square of their diameter instead of their
diameter.
In Fig. 7.3 another mode occurs in the clay size range smaller than 0.002 mm,
probably due in part to clay adhering to coarser grains when they settled out. Two
or more modes also can indicate soil mixtures, as when two strata are combined in
one sample or sand has infiltrated into interstices in a gravel deposit. B horizon
soils are bimodal because of infiltration by clay from the A horizon. Engineered
soils often are mixtures in order to improve their engineering properties.
Downloaded from Digital Engineering Library @ McGraw-Hill (www.digitalengineeringlibrary.com)
Copyright © 2007 The McGraw-Hill Companies. All rights reserved.
Any use is subject to the Terms of Use as given at the website.