
Page 251 - Geothermal Energy Renewable Energy and The Environment
P. 251
240 Geothermal Energy: Renewable Energy and the Environment
80
70
Crystalline rocks
60
Bulk modulus (GPa) 40
50
30
20 Porous glass
10
Sediments
0
0 0.2 0.4 0.6 0.8 1.0
Porosity
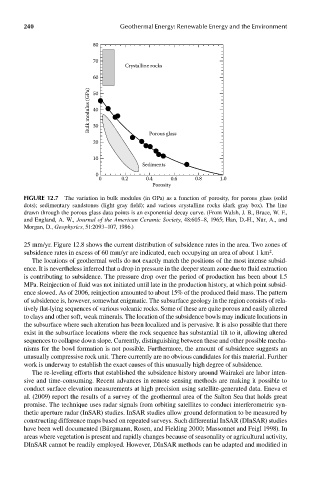
FIGUre 12.7 The variation in bulk modulus (in GPa) as a function of porosity, for porous glass (solid
dots); sedimentary sandstones (light gray field); and various crystalline rocks (dark gray box). The line
drawn through the porous glass data points is an exponential decay curve. (From Walsh, J. B., Brace, W. F.,
and England, A. W., Journal of the American Ceramic Society, 48:605–8, 1965; Han, D.-H., Nur, A., and
Morgan, D., Geophysics, 51:2093–107, 1986.)
25 mm/yr. Figure 12.8 shows the current distribution of subsidence rates in the area. Two zones of
2
subsidence rates in excess of 60 mm/yr are indicated, each occupying an area of about 1 km .
The locations of geothermal wells do not exactly match the positions of the most intense subsid-
ence. It is nevertheless inferred that a drop in pressure in the deeper steam zone due to fluid extraction
is contributing to subsidence. The pressure drop over the period of production has been about 1.5
MPa. Reinjection of fluid was not initiated until late in the production history, at which point subsid-
ence slowed. As of 2006, reinjection amounted to about 15% of the produced fluid mass. The pattern
of subsidence is, however, somewhat enigmatic. The subsurface geology in the region consists of rela-
tively flat-lying sequences of various volcanic rocks. Some of these are quite porous and easily altered
to clays and other soft, weak minerals. The location of the subsidence bowls may indicate locations in
the subsurface where such alteration has been localized and is pervasive. It is also possible that there
exist in the subsurface locations where the rock sequence has substantial tilt to it, allowing altered
sequences to collapse down slope. Currently, distinguishing between these and other possible mecha-
nisms for the bowl formation is not possible. Furthermore, the amount of subsidence suggests an
unusually compressive rock unit. There currently are no obvious candidates for this material. Further
work is underway to establish the exact causes of this unusually high degree of subsidence.
The re-leveling efforts that established the subsidence history around Wairakei are labor inten-
sive and time-consuming. Recent advances in remote sensing methods are making it possible to
conduct surface elevation measurements at high precision using satellite-generated data. Eneva et
al. (2009) report the results of a survey of the geothermal area of the Salton Sea that holds great
promise. The technique uses radar signals from orbiting satellites to conduct interferometric syn-
thetic aperture radar (InSAR) studies. InSAR studies allow ground deformation to be measured by
constructing difference maps based on repeated surveys. Such differential InSAR (DInSAR) studies
have been well documented (Bürgmann, Rosen, and Fielding 2000; Massonnet and Feigl 1998). In
areas where vegetation is present and rapidly changes because of seasonality or agricultural activity,
DInSAR cannot be readily employed. However, DInSAR methods can be adapted and modified in