
Page 254 - Geothermal Energy Renewable Energy and The Environment
P. 254
Use of Geothermal Resources: Environmental Considerations 243
Site restoration must follow drilling. This effort includes removing the mud from the sumps
and backfilling them, removal of all drilling equipment and supplies, and reforming the terrain, if
appropriate. At completion, the wellhead and apron around it will occupy an area significantly less
2
than 100 m . For direct use and ground source heat pump installations the wellhead and apron will
2
occupy an area less than 5 m .
Construction of a generating facility must include all aspects of the conversion technology that
are required to get the power to a distribution system. In addition, feed stocks for the fuel cycle
and habitat fragmentation are also an integral part of the overall footprint a conversion technol-
ogy imposes on the land. McDonald et al. (2009) undertook an analysis of land area impacted by
various energy conversion technologies. Their analysis included consideration of various policies
that might be emplaced to reduce carbon emissions, and projected the results to 2030, which is
one of the years for which the United States Energy Information Administration has developed
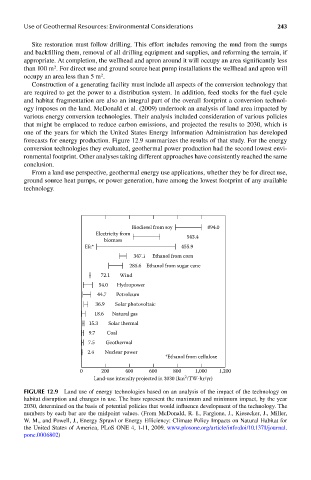
forecasts for energy production. Figure 12.9 summarizes the results of that study. For the energy
conversion technologies they evaluated, geothermal power production had the second lowest envi-
ronmental footprint. Other analyses taking different approaches have consistently reached the same
conclusion.
From a land use perspective, geothermal energy use applications, whether they be for direct use,
ground source heat pumps, or power generation, have among the lowest footprint of any available
technology.
Biodiesel from soy 894.0
Electricity from 543.4
biomass
Efc* 455.9
347.1 Ethanol from corn
285.6 Ethanol from sugar cane
72.1 Wind
54.0 Hydropower
44.7 Petroleum
36.9 Solar photovoltaic
18.6 Natural gas
15.3 Solar thermal
9.7 Coal
7.5 Geothermal
2.4 Nuclear power
*Ethanol from cellulose
0 200 400 600 800 1,000 1,200
2
Land-use intensity projected in 2030 (km /TW-hr/yr)
FIGUre 12.9 Land use of energy technologies based on an analysis of the impact of the technology on
habitat disruption and changes in use. The bars represent the maximum and minimum impact, by the year
2030, determined on the basis of potential policies that would influence development of the technology. The
numbers by each bar are the midpoint values. (From McDonald, R. I., Fargione, J., Kiesecker, J., Miller,
W. M., and Powell, J., Energy Sprawl or Energy Efficiency: Climate Policy Impacts on Natural Habitat for
the United States of America, PLoS ONE 4, 1-11, 2009. www.plosone.org/article/info:doi/10.1371/journal.
pone.0006802)