
Page 250 - Geothermal Energy Renewable Energy and The Environment
P. 250
Use of Geothermal Resources: Environmental Considerations 239
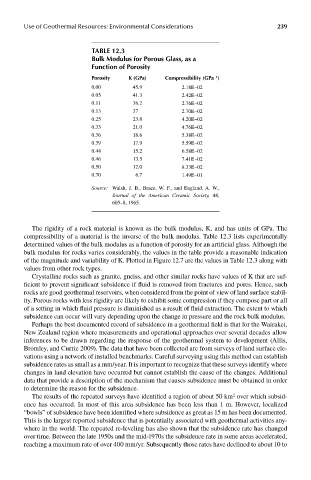
Table 12.3
bulk modulus for porous Glass, as a
Function of porosity
porosity k (Gpa) compressibility (Gpa )
−1
0.00 45.9 2.18E−02
0.05 41.3 2.42E−02
0.11 36.2 2.76E−02
0.13 37 2.70E−02
0.25 23.8 4.20E−02
0.33 21.0 4.76E−02
0.36 18.6 5.38E−02
0.39 17.9 5.59E−02
0.44 15.2 6.58E−02
0.46 13.5 7.41E−02
0.50 12.0 8.33E−02
0.70 6.7 1.49E−01
Source: Walsh, J. B., Brace, W. F., and England, A. W.,
Journal of the American Ceramic Society, 48,
605–8, 1965.
The rigidity of a rock material is known as the bulk modulus, K, and has units of GPa. The
compressibility of a material is the inverse of the bulk modulus. Table 12.3 lists experimentally
determined values of the bulk modulus as a function of porosity for an artificial glass. Although the
bulk modulus for rocks varies considerably, the values in the table provide a reasonable indication
of the magnitude and variability of K. Plotted in Figure 12.7 are the values in Table 12.3 along with
values from other rock types.
Crystalline rocks such as granite, gneiss, and other similar rocks have values of K that are suf-
ficient to prevent significant subsidence if fluid is removed from fractures and pores. Hence, such
rocks are good geothermal reservoirs, when considered from the point of view of land surface stabil-
ity. Porous rocks with less rigidity are likely to exhibit some compression if they compose part or all
of a setting in which fluid pressure is diminished as a result of fluid extraction. The extent to which
subsidence can occur will vary depending upon the change in pressure and the rock bulk modulus.
Perhaps the best documented record of subsidence in a geothermal field is that for the Wairakei,
New Zealand region where measurements and operational approaches over several decades allow
inferences to be drawn regarding the response of the geothermal system to development (Allis,
Bromley, and Currie 2009). The data that have been collected are from surveys of land surface ele-
vations using a network of installed benchmarks. Careful surveying using this method can establish
subsidence rates as small as a mm/year. It is important to recognize that these surveys identify where
changes in land elevation have occurred but cannot establish the cause of the changes. Additional
data that provide a description of the mechanism that causes subsidence must be obtained in order
to determine the reason for the subsidence.
2
The results of the repeated surveys have identified a region of about 50 km over which subsid-
ence has occurred. In most of this area subsidence has been less than 1 m. However, localized
“bowls” of subsidence have been identified where subsidence as great as 15 m has been documented.
This is the largest reported subsidence that is potentially associated with geothermal activities any-
where in the world. The repeated re-leveling has also shown that the subsidence rate has changed
over time. Between the late 1950s and the mid-1970s the subsidence rate in some areas accelerated,
reaching a maximum rate of over 400 mm/yr. Subsequently those rates have declined to about 10 to