
Page 265 - Geothermal Energy Renewable Energy and The Environment
P. 265
Use of Geothermal Resources: Economic Considerations 255
performance. One such approach considers the relationship between investment and performance to
evaluate how a technology will perform in the marketplace.
economIcs oF r&d InVesTmenT In GeoThermal enerGy
TechnoloGy evoluTion and s-curves
The relationship between the return on investment made in a technology and the maturity of that
technology is complex. Despite the fact that a variety of factors influence that relationship, it has
been repeatedly demonstrated (Ayres 1994) that a general pattern emerges that has become known
as experience curves or, in a more recent and refined approach, technology S-curves (Schilling and
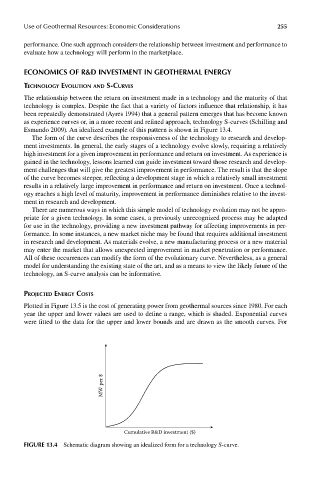
Esmundo 2009). An idealized example of this pattern is shown in Figure 13.4.
The form of the curve describes the responsiveness of the technology to research and develop-
ment investments. In general, the early stages of a technology evolve slowly, requiring a relatively
high investment for a given improvement in performance and return on investment. As experience is
gained in the technology, lessons learned can guide investment toward those research and develop-
ment challenges that will give the greatest improvement in performance. The result is that the slope
of the curve becomes steeper, reflecting a development stage in which a relatively small investment
results in a relatively large improvement in performance and return on investment. Once a technol-
ogy reaches a high level of maturity, improvement in performance diminishes relative to the invest-
ment in research and development.
There are numerous ways in which this simple model of technology evolution may not be appro-
priate for a given technology. In some cases, a previously unrecognized process may be adapted
for use in the technology, providing a new investment pathway for affecting improvements in per-
formance. In some instances, a new market niche may be found that requires additional investment
in research and development. As materials evolve, a new manufacturing process or a new material
may enter the market that allows unexpected improvement in market penetration or performance.
All of these occurrences can modify the form of the evolutionary curve. Nevertheless, as a general
model for understanding the existing state of the art, and as a means to view the likely future of the
technology, an S-curve analysis can be informative.
projecTed enerGy cosTs
Plotted in Figure 13.5 is the cost of generating power from geothermal sources since 1980. For each
year the upper and lower values are used to define a range, which is shaded. Exponential curves
were fitted to the data for the upper and lower bounds and are drawn as the smooth curves. For
MW per $
Cumulative R&D investment ($)
FIGUre 13.4 Schematic diagram showing an idealized form for a technology S-curve.