
Page 266 - Geothermal Energy Renewable Energy and The Environment
P. 266
256 Geothermal Energy: Renewable Energy and the Environment
14.0
12.0
Range of generation cost
for producing geothermal
10.0 power
Levelized cost
Cents/kWh 6.0
8.0
for geothermal
Cost of generating power
4.0 from fossil fuels
2.0
0.0
1975 1980 1985 1990 1995 2000 2005 2010
Year
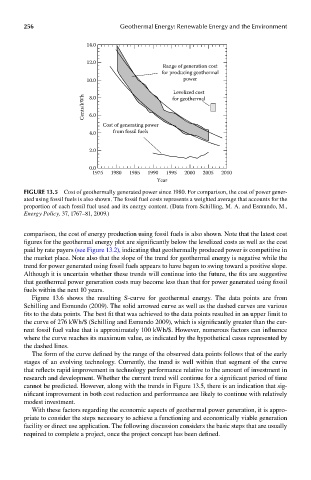
FIGUre 13.5 Cost of geothermally generated power since 1980. For comparison, the cost of power gener-
ated using fossil fuels is also shown. The fossil fuel costs represents a weighted average that accounts for the
proportion of each fossil fuel used and its energy content. (Data from Schilling, M. A. and Esmundo, M.,
Energy Policy, 37, 1767–81, 2009.)
comparison, the cost of energy production using fossil fuels is also shown. Note that the latest cost
figures for the geothermal energy plot are significantly below the levelized costs as well as the cost
paid by rate payers (see Figure 13.2), indicating that geothermally produced power is competitive in
the market place. Note also that the slope of the trend for geothermal energy is negative while the
trend for power generated using fossil fuels appears to have begun to swing toward a positive slope.
Although it is uncertain whether these trends will continue into the future, the fits are suggestive
that geothermal power generation costs may become less than that for power generated using fossil
fuels within the next 10 years.
Figure 13.6 shows the resulting S-curve for geothermal energy. The data points are from
Schilling and Esmundo (2009). The solid arrowed curve as well as the dashed curves are various
fits to the data points. The best fit that was achieved to the data points resulted in an upper limit to
the curve of 276 kWh/$ (Schilling and Esmundo 2009), which is significantly greater than the cur-
rent fossil fuel value that is approximately 100 kWh/$. However, numerous factors can influence
where the curve reaches its maximum value, as indicated by the hypothetical cases represented by
the dashed lines.
The form of the curve defined by the range of the observed data points follows that of the early
stages of an evolving technology. Currently, the trend is well within that segment of the curve
that reflects rapid improvement in technology performance relative to the amount of investment in
research and development. Whether the current trend will continue for a significant period of time
cannot be predicted. However, along with the trends in Figure 13.5, there is an indication that sig-
nificant improvement in both cost reduction and performance are likely to continue with relatively
modest investment.
With these factors regarding the economic aspects of geothermal power generation, it is appro-
priate to consider the steps necessary to achieve a functioning and economically viable generation
facility or direct use application. The following discussion considers the basic steps that are usually
required to complete a project, once the project concept has been defined.