
Page 199 - Geothermal Energy Systems Exploration, Development, and Utilization
P. 199
4.2 Initial Situation at the Specific Location 175
Depth (m) 30 Core porosity 0 1000 mD 0.001 Stimulated sections
Stratigraphy Lithology GR NPHI Calc. permeability Temperature after
stimulation
%
Core permeability
Clay Silt Sand Conglomerate 0 api 240 30 % 0 1000 mD 0.001 125 °C 150
f m c f m c
Upper rotliegend II Elbe subgroup Dethlingen-Fm. 4100
4150
Havel 4200
subgr.
Lower 4250
rotliegend
Carbonif. 4300
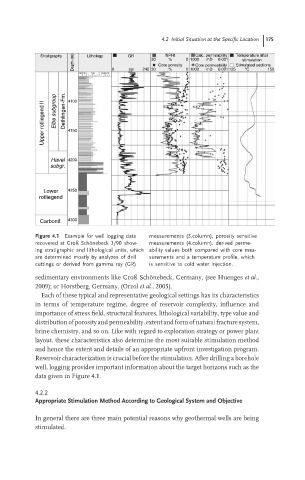
Figure 4.1 Example for well logging data measurements (3.column), porosity sensitive
recovered at Groß Sch¨onebeck 3/90 show- measurements (4.column), derived perme-
ing stratigraphic and lithological units, which ability values both compared with core mea-
are determined mostly by analyzes of drill surements and a temperature profile, which
cuttings or derived from gamma ray (GR) is sensitive to cold water injection.
sedimentary environments like Groß Sch¨ onebeck, Germany, (see Huenges et al.,
2009); or Horstberg, Germany, (Orzol et al., 2005).
Each of these typical and representative geological settings has its characteristics
in terms of temperature regime, degree of reservoir complexity, influence and
importance of stress field, structural features, lithological variability, type value and
distribution of porosity and permeability, extent and form of natural fracture system,
brine chemistry, and so on. Like with regard to exploration strategy or power plant
layout, these characteristics also determine the most suitable stimulation method
and hence the extent and details of an appropriate upfront investigation program.
Reservoir characterization is crucial before the stimulation. After drilling a borehole
well, logging provides important information about the target horizons such as the
data giveninFigure 4.1.
4.2.2
Appropriate Stimulation Method According to Geological System and Objective
In general there are three main potential reasons why geothermal wells are being
stimulated.