
Page 204 - Geothermal Energy Systems Exploration, Development, and Utilization
P. 204
180 4 Enhancing Geothermal Reservoirs
FMI (03.11.03) FMI (03.11.03) FMI (03.11.03)
Dynamic normalisation Dynamic normalisation Dynamic normalisation
N E S W N N E S W N N E S W N
Resistive Conductive Resistive Conductive Resistive Conductive
4151 4199
4152 4202
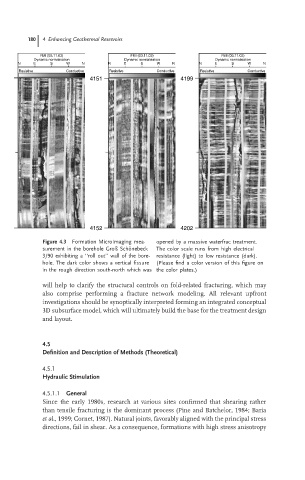
Figure 4.3 Formation MicroImaging mea- opened by a massive waterfrac treatment.
surement in the borehole Groß Sch¨onebeck The color scale runs from high electrical
3/90 exhibiting a ‘‘roll out’’ wall of the bore- resistance (light) to low resistance (dark).
hole. The dark color shows a vertical fissure (Please find a color version of this figure on
in the rough direction south-north which was the color plates.)
will help to clarify the structural controls on fold-related fracturing, which may
also comprise performing a fracture network modeling. All relevant upfront
investigations should be synoptically interpreted forming an integrated conceptual
3D subsurface model, which will ultimately build the base for the treatment design
and layout.
4.5
Definition and Description of Methods (Theoretical)
4.5.1
Hydraulic Stimulation
4.5.1.1 General
Since the early 1980s, research at various sites confirmed that shearing rather
than tensile fracturing is the dominant process (Pine and Batchelor, 1984; Baria
et al., 1999; Cornet, 1987). Natural joints, favorably aligned with the principal stress
directions, fail in shear. As a consequence, formations with high stress anisotropy