
Page 270 - Global Tectonics
P. 270
SUBDUCTION ZONES 255
Figure 9.7 Schematic section across the Tonga arc showing the zone of very high seismic attenuation beneath the
Lau backarc basin (redrawn from Barazangi & Isacks, 1971, by permission of the American Geophysical Union.
Copyright © 1971 American Geophysical Union).
0
a
b Lithosphere
100
Asthenosphere
c
200
Km
300
400
d
500
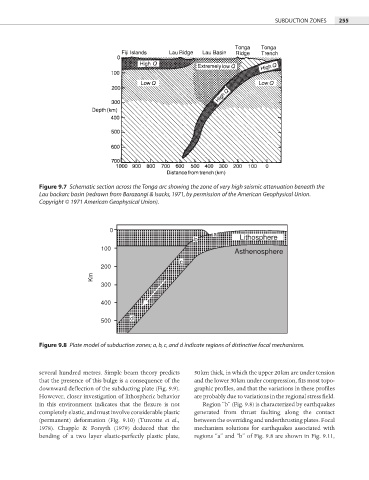
Figure 9.8 Plate model of subduction zones; a, b, c, and d indicate regions of distinctive focal mechanisms.
several hundred metres. Simple beam theory predicts 50 km thick, in which the upper 20 km are under tension
that the presence of this bulge is a consequence of the and the lower 30 km under compression, fits most topo-
downward deflection of the subducting plate (Fig. 9.9). graphic profiles, and that the variations in these profi les
However, closer investigation of lithospheric behavior are probably due to variations in the regional stress fi eld.
in this environment indicates that the flexure is not Region “b” (Fig. 9.8) is characterized by earthquakes
completely elastic, and must involve considerable plastic generated from thrust faulting along the contact
(permanent) deformation (Fig. 9.10) (Turcotte et al., between the overriding and underthrusting plates. Focal
1978). Chapple & Forsyth (1979) deduced that the mechanism solutions for earthquakes associated with
bending of a two layer elastic-perfectly plastic plate, regions “a” and “b” of Fig. 9.8 are shown in Fig. 9.11,