
Page 285 - Global Tectonics
P. 285
270 CHAPTER 9
(a) 18
MX
16
14 CH
12
Taper angle 10 JA AL ASH NC CA
8
CS NI
6 SC
SU LU
EA
MUR
4 BU SA
NA
AN
MA
2
0 1000 2000 3000 4000 5000 6000 7000 8000
Incoming sediment thickness (m)
1
México: v 70 mm a ;
(b) MX t 825 m; β 4 ; α 13
15 20 km
Observed taper angle (degrees) 10 5 NC ASH N. Cascadia: v 32 mm a ; Ashizuri Nankai: v 40 mm a ;
1
1
t 1050 m; β 2.6 ; α 1.5
t 2500 m; β 4 ; α 4
20 km
20 km
EA
MUR
1
NA
20 km N. Antilles: v 28 mm a ; t 700–800 m; β 2 ; α 1
0
100 80 60 40 20 0
% of incoming section dominated by clay/mud
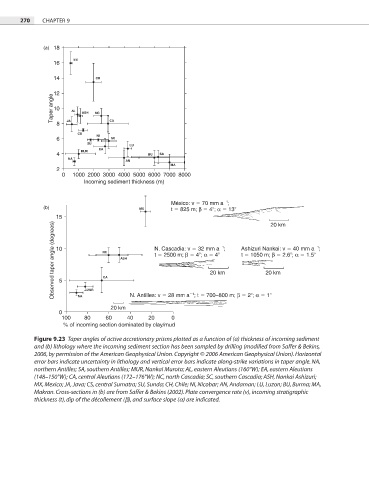
Figure 9.23 Taper angles of active accretionary prisms plotted as a function of (a) thickness of incoming sediment
and (b) lithology where the incoming sediment section has been sampled by drilling (modified from Saffer & Bekins,
2006, by permission of the American Geophysical Union. Copyright © 2006 American Geophysical Union). Horizontal
error bars indicate uncertainty in lithology and vertical error bars indicate along-strike variations in taper angle. NA,
northern Antilles; SA, southern Antilles; MUR, Nankai Muroto; AL, eastern Aleutians (160°W); EA, eastern Aleutians
(148–150°W); CA, central Aleutians (172–176°W); NC, north Cascadia; SC, southern Cascadia; ASH, Nankai Ashizuri;
MX, Mexico; JA, Java; CS, central Sumatra; SU, Sunda; CH, Chile; NI, Nicobar; AN, Andaman; LU, Luzon; BU, Burma; MA,
Makran. Cross-sections in (b) are from Saffer & Bekins (2002). Plate convergence rate (v), incoming stratigraphic
thickness (t), dip of the décollement (b), and surface slope (a) are indicated.