
Page 283 - Global Tectonics
P. 283
268 CHAPTER 9
(a)
α
surface slope
Toe
Accretionary wedge α + β
Décollement β
(b)
10°
8° 0.5 0.4
0.7 0.6 λ = λ b =0
Guatemala
Surface slope, α 6° Sunda
0.8
Japan
Peru
0.9
Aleutian
4°
Java
Oregon
Makran
2° 0.97
Barbados overall
Barbados toe
0°
0° 2° 4° 6° 8° 10° 12°
Basal dip, β
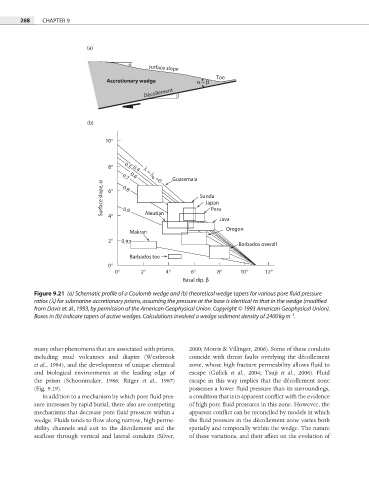
Figure 9.21 (a) Schematic profile of a Coulomb wedge and (b) theoretical wedge tapers for various pore fl uid pressure
ratios (l) for submarine accretionary prisms, assuming the pressure at the base is identical to that in the wedge (modifi ed
from Davis et al., 1993, by permission of the American Geophysical Union. Copyright © 1993 American Geophysical Union).
−3
Boxes in (b) indicate tapers of active wedges. Calculations involved a wedge sediment density of 2400 kg m .
many other phenomena that are associated with prisms, 2000; Morris & Villinger, 2006). Some of these conduits
including mud volcanoes and diapirs (Westbrook coincide with thrust faults overlying the décollement
et al., 1984), and the development of unique chemical zone, whose high fracture permeability allows fl uid to
and biological environments at the leading edge of escape (Gulick et al., 2004; Tsuji et al., 2006). Fluid
the prism (Schoonmaker, 1986; Ritger et al., 1987) escape in this way implies that the décollement zone
(Fig. 9.19). possesses a lower fluid pressure than its surroundings,
In addition to a mechanism by which pore fl uid pres- a condition that is in apparent conflict with the evidence
sure increases by rapid burial, there also are competing of high pore fluid pressures in this zone. However, the
mechanisms that decrease pore fluid pressure within a apparent conflict can be reconciled by models in which
wedge. Fluids tends to flow along narrow, high perme- the fluid pressure in the décollement zone varies both
ability channels and exit to the décollement and the spatially and temporally within the wedge. The nature
seafloor through vertical and lateral conduits (Silver, of these variations, and their affect on the evolution of