
Page 186 - Green Building Through Integrated Design
P. 186
162 INTEGRATED PROJECT MANAGEMENT—COST/BENEFIT ANALYSIS OF GREEN BUILDINGS
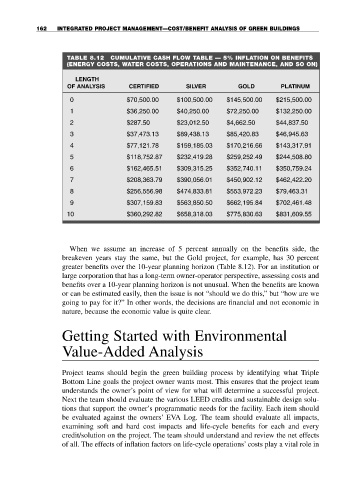
TABLE 8.12 CUMULATIVE CASH FLOW TABLE — 5% INFLATION ON BENEFITS
(ENERGY COSTS, WATER COSTS, OPERATIONS AND MAINTENANCE, AND SO ON)
LENGTH
OF ANALYSIS CERTIFIED SILVER GOLD PLATINUM
0 $70,500.00 $100,500.00 $145,500.00 $215,500.00
1 $36,250.00 $40,250.00 $72,250.00 $132,250.00
2 $287.50 $23,012.50 $4,662.50 $44,837.50
3 $37,473.13 $89,438.13 $85,420.83 $46,945.63
4 $77,121.78 $159,185.03 $170,216.66 $143,317.91
5 $118,752.87 $232,419.28 $259,252.49 $244,508.80
6 $162,465.51 $309,315.25 $352,740.11 $350,759.24
7 $208,363.79 $390,056.01 $450,902.12 $462,422.20
8 $256,556.98 $474,833.81 $553,972.23 $79,463.31
9 $307,159.83 $563,850.50 $662,195.84 $702,461.48
10 $360,292.82 $658,318.03 $775,830.63 $831,609.55
When we assume an increase of 5 percent annually on the benefits side, the
breakeven years stay the same, but the Gold project, for example, has 30 percent
greater benefits over the 10-year planning horizon (Table 8.12). For an institution or
large corporation that has a long-term owner-operator perspective, assessing costs and
benefits over a 10-year planning horizon is not unusual. When the benefits are known
or can be estimated easily, then the issue is not “should we do this,” but “how are we
going to pay for it?” In other words, the decisions are financial and not economic in
nature, because the economic value is quite clear.
Getting Started with Environmental
Value-Added Analysis
Project teams should begin the green building process by identifying what Triple
Bottom Line goals the project owner wants most. This ensures that the project team
understands the owner’s point of view for what will determine a successful project.
Next the team should evaluate the various LEED credits and sustainable design solu-
tions that support the owner’s programmatic needs for the facility. Each item should
be evaluated against the owners’ EVA Log. The team should evaluate all impacts,
examining soft and hard cost impacts and life-cycle benefits for each and every
credit/solution on the project. The team should understand and review the net effects
of all. The effects of inflation factors on life-cycle operations’ costs play a vital role in