
Page 195 -
P. 195
The Beginning and the End? • 167
3. Characterization: modeling LCI impacts within impact categories
using science-based conversion factors (e.g., modeling the potential
impact of carbon dioxide and methane on global warming)
4. Normalization: expressing potential impacts in ways that can be
compared (e.g., comparing the global-warming impact of carbon
dioxide and methane for the two options)
5. Grouping: sorting or ranking the indicators (e.g., sorting the indica-
tors by location: local, regional, and global)
6. Weighting: emphasizing the most important potential impacts
7. Evaluating and Reporting LCIA Results: gaining a better understand-
ing of the reliability of the LCIA results
interpretation
Now it’s time to take the carefully researched and categorized information
and convert it carefully into knowledge and wisdom. Attempting to “col-
lapse” indicator values to a single score must be done with extreme cau-
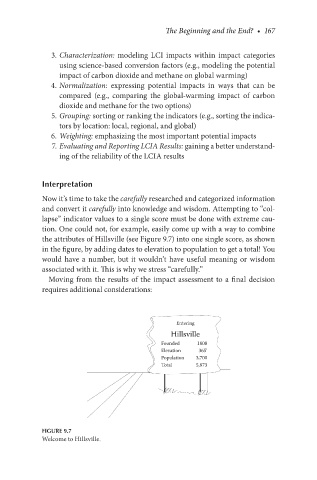
tion. One could not, for example, easily come up with a way to combine
the attributes of Hillsville (see Figure 9.7) into one single score, as shown
in the figure, by adding dates to elevation to population to get a total! You
would have a number, but it wouldn’t have useful meaning or wisdom
associated with it. This is why we stress “carefully.”
Moving from the results of the impact assessment to a final decision
requires additional considerations:
Entering
Hillsville
Founded 1808
Elevation 365’
Population 3,700
Total 5,873
Figure 9.7
Welcome to Hillsville.