
Page 197 -
P. 197
The Beginning and the End? • 169
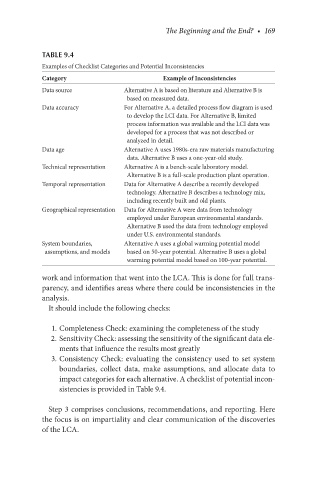
taBle 9.4
Examples of Checklist Categories and Potential Inconsistencies
category example of Inconsistencies
Data source Alternative A is based on literature and Alternative B is
based on measured data.
Data accuracy For Alternative A, a detailed process flow diagram is used
to develop the LCI data. For Alternative B, limited
process information was available and the LCI data was
developed for a process that was not described or
analyzed in detail.
Data age Alternative A uses 1980s-era raw materials manufacturing
data. Alternative B uses a one-year-old study.
Technical representation Alternative A is a bench-scale laboratory model.
Alternative B is a full-scale production plant operation.
Temporal representation Data for Alternative A describe a recently developed
technology. Alternative B describes a technology mix,
including recently built and old plants.
Geographical representation Data for Alternative A were data from technology
employed under European environmental standards.
Alternative B used the data from technology employed
under U.S. environmental standards.
System boundaries, Alternative A uses a global warming potential model
assumptions, and models based on 50-year potential. Alternative B uses a global
warming potential model based on 100-year potential.
work and information that went into the LCA. This is done for full trans-
parency, and identifies areas where there could be inconsistencies in the
analysis.
It should include the following checks:
1. Completeness Check: examining the completeness of the study
2. Sensitivity Check: assessing the sensitivity of the significant data ele-
ments that influence the results most greatly
3. Consistency Check: evaluating the consistency used to set system
boundaries, collect data, make assumptions, and allocate data to
impact categories for each alternative. A checklist of potential incon-
sistencies is provided in Table 9.4.
Step 3 comprises conclusions, recommendations, and reporting. Here
the focus is on impartiality and clear communication of the discoveries
of the LCA.