
Page 43 - Aamir Rehman Gulf Capital and Islamic Finance The Rise of the New Global Players
P. 43
28 PART I Background and Context
HEALTHY SURPLUSES
The large reserves that the Gulf enjoys today have been enabled by
healthy budget surpluses over the past decades. Surpluses have var-
ied greatly from year to year based on the market price of oil, and
some years have seen deficits. In fact, Saudi Arabia—the core economy
of the region—expects a deficit in 2009 as a result of an expansionary
budget designed to stimulate the local economy. 18 Nonetheless, siz-
able surpluses have been the norm in the wealthier Gulf states, espe-
cially in recent years.
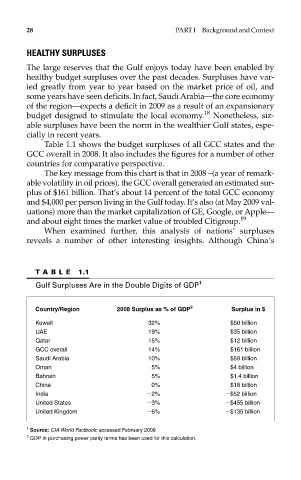
Table 1.1 shows the budget surpluses of all GCC states and the
GCC overall in 2008. It also includes the figures for a number of other
countries for comparative perspective.
The key message from this chart is that in 2008 –(a year of remark-
able volatility in oil prices), the GCC overall generated an estimated sur-
plus of $161 billion. That’s about 14 percent of the total GCC economy
and $4,000 per person living in the Gulf today. It’s also (at May 2009 val-
uations) more than the market capitalization of GE, Google, or Apple—
and about eight times the market value of troubled Citigroup. 19
When examined further, this analysis of nations’ surpluses
reveals a number of other interesting insights. Although China’s
T ABLE 1.1
Gulf Surpluses Are in the Double Digits of GDP 1
Country/Region 2008 Surplus as % of GDP 2 Surplus in $
Kuwait 32% $50 billion
UAE 19% $35 billion
Qatar 15% $12 billion
GCC overall 14% $161 billion
Saudi Arabia 10% $59 billion
Oman 5% $4 billion
Bahrain 5% $1.4 billion
China 0% $18 billion
India 2% $52 billion
United States 3% $455 billion
United Kingdom 6% $135 billion
1
Source: CIA World Factbook; accessed February 2009.
2
GDP in purchasing power parity terms has been used for this calculation.