
Page 33 - Handbook of Thermal Analysis of Construction Materials
P. 33
Section 2.0 - Classical Techniques 17
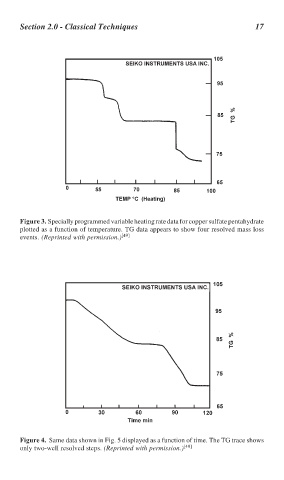
Figure 3. Specially programmed variable heating rate data for copper sulfate pentahydrate
plotted as a function of temperature. TG data appears to show four resolved mass loss
events. (Reprinted with permission.) [49]
Figure 4. Same data shown in Fig. 5 displayed as a function of time. The TG trace shows
only two-well resolved steps. (Reprinted with permission.) [49]