
Page 446 - Handbook of Thermal Analysis of Construction Materials
P. 446
Section 2.0 - Calcium Aluminate Cements 421
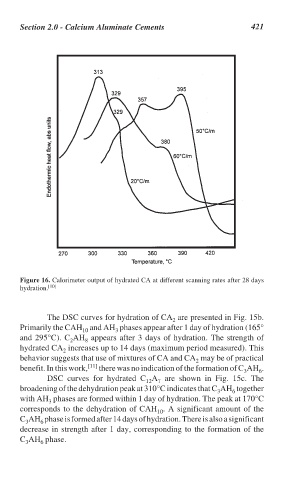
Figure 16. Calorimeter output of hydrated CA at different scanning rates after 28 days
hydration. [10]
The DSC curves for hydration of CA are presented in Fig. 15b.
2
Primarily the CAH and AH phases appear after 1 day of hydration (165°
3
10
and 295°C). C AH appears after 3 days of hydration. The strength of
2 8
hydrated CA increases up to 14 days (maximum period measured). This
2
behavior suggests that use of mixtures of CA and CA may be of practical
2
benefit. In this work, [11] there was no indication of the formation of C AH .
3
6
DSC curves for hydrated C A are shown in Fig. 15c. The
12 7
broadening of the dehydration peak at 310°C indicates that C AH together
6
3
with AH phases are formed within 1 day of hydration. The peak at 170°C
3
corresponds to the dehydration of CAH . A significant amount of the
10
C AH phase is formed after 14 days of hydration. There is also a significant
3 6
decrease in strength after 1 day, corresponding to the formation of the
C AH phase.
3 6