
Page 449 - Handbook of Thermal Analysis of Construction Materials
P. 449
424 Chapter 10 - Non-Portland Rapid Setting Cements
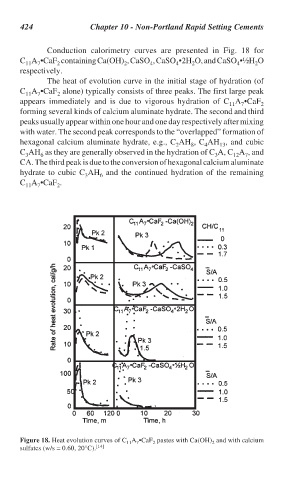
Conduction calorimetry curves are presented in Fig. 18 for
C A •CaF containing Ca(OH) , CaSO , CaSO •2H O, and CaSO •½H O
2
2
7
11
2
4
2
4
4
respectively.
The heat of evolution curve in the initial stage of hydration (of
C A •CaF alone) typically consists of three peaks. The first large peak
7
2
11
appears immediately and is due to vigorous hydration of C A •CaF
11 7 2
forming several kinds of calcium aluminate hydrate. The second and third
peaks usually appear within one hour and one day respectively after mixing
with water. The second peak corresponds to the “overlapped” formation of
hexagonal calcium aluminate hydrate, e.g., C AH , C AH , and cubic
4
8
2
13
C AH as they are generally observed in the hydration of C A, C A , and
12
6
3
7
3
CA. The third peak is due to the conversion of hexagonal calcium aluminate
hydrate to cubic C AH and the continued hydration of the remaining
3
6
C A •CaF .
11 7 2
Figure 18. Heat evolution curves of C A •CaF pastes with Ca(OH) and with calcium
7
11
2
2
sulfates (w/s = 0.60, 20°C). [14]