
Page 448 - Handbook of Thermal Analysis of Construction Materials
P. 448
Section 3.0 - Jet Set (Regulated Set) Cement 423
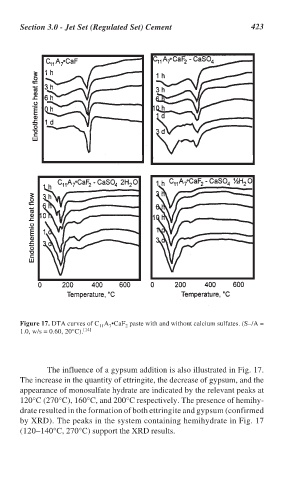
Figure 17. DTA curves of C A •CaF paste with and without calcium sulfates. (S–/A =
11
2
7
1.0, w/s = 0.60, 20°C). [14]
The influence of a gypsum addition is also illustrated in Fig. 17.
The increase in the quantity of ettringite, the decrease of gypsum, and the
appearance of monosulfate hydrate are indicated by the relevant peaks at
120°C (270°C), 160°C, and 200°C respectively. The presence of hemihy-
drate resulted in the formation of both ettringite and gypsum (confirmed
by XRD). The peaks in the system containing hemihydrate in Fig. 17
(120–140°C, 270°C) support the XRD results.