
Page 499 - Handbook of Thermal Analysis of Construction Materials
P. 499
Section 7.0 - Controlled Transformation Rate (CRTA) 471
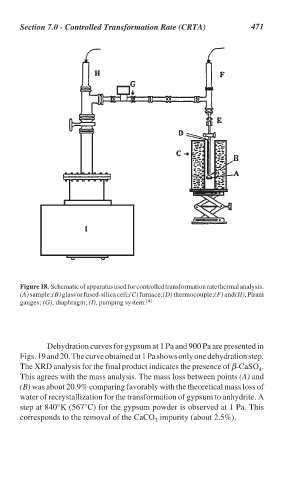
Figure 18. Schematic of apparatus used for controlled transformation rate thermal analysis.
(A) sample; (B) glass or fused-silica cell; (C) furnace; (D) thermocouple; (F) and (H), Pirani
gauges; (G), diaphragm; (I), pumping system. [4]
Dehydration curves for gypsum at 1 Pa and 900 Pa are presented in
Figs. 19 and 20. The curve obtained at 1 Pa shows only one dehydration step.
The XRD analysis for the final product indicates the presence of β-CaSO .
4
This agrees with the mass analysis. The mass loss between points (A) and
(B) was about 20.9% comparing favorably with the theoretical mass loss of
water of recrystallization for the transformation of gypsum to anhydrite. A
step at 840°K (567°C) for the gypsum powder is observed at 1 Pa. This
corresponds to the removal of the CaCO impurity (about 2.5%).
3