
Page 503 - Handbook of Thermal Analysis of Construction Materials
P. 503
Section 7.0 - Controlled Transformation Rate (CRTA) 475
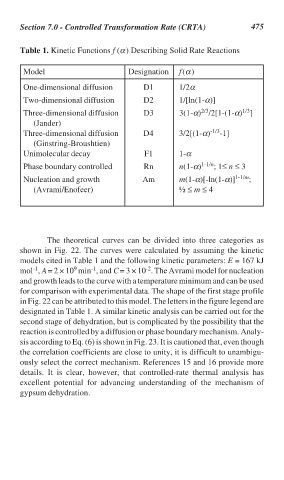
Table 1. Kinetic Functions f (α) Describing Solid Rate Reactions
Model Designation f(α)
One-dimensional diffusion D1 1/2α
Two-dimensional diffusion D2 1/[ln(1-α)]
2/3
1/3
Three-dimensional diffusion D3 3(1-α) /2[1-(1-α) ]
(Jander)
Three-dimensional diffusion D4 3/2[(1-α) -1/3 -1]
(Ginstring-Broushtien)
Unimolecular decay F1 1-α
Phase boundary controlled Rn n(1-α) 1-1/n ; 1≤ n ≤ 3
Nucleation and growth Am m(1-α)[-ln(1-α)] 1-1/m ;
(Avrami/Enofeer) ½ ≤ m ≤ 4
The theoretical curves can be divided into three categories as
shown in Fig. 22. The curves were calculated by assuming the kinetic
models cited in Table 1 and the following kinetic parameters: E = 167 kJ
-2
9
-1
-1
mol , A = 2 × 10 min , and C = 3 × 10 . The Avrami model for nucleation
and growth leads to the curve with a temperature minimum and can be used
for comparison with experimental data. The shape of the first stage profile
in Fig. 22 can be attributed to this model. The letters in the figure legend are
designated in Table 1. A similar kinetic analysis can be carried out for the
second stage of dehydration, but is complicated by the possibility that the
reaction is controlled by a diffusion or phase boundary mechanism. Analy-
sis according to Eq. (6) is shown in Fig. 23. It is cautioned that, even though
the correlation coefficients are close to unity, it is difficult to unambigu-
ously select the correct mechanism. References 15 and 16 provide more
details. It is clear, however, that controlled-rate thermal analysis has
excellent potential for advancing understanding of the mechanism of
gypsum dehydration.