
Page 206 - Geology and Geochemistry of Oil and Gas
P. 206
OIL AND GAS ACCUMULATIONS AND TRAPS 175
TABLE 10.1
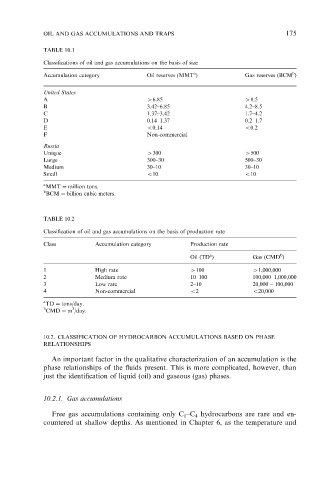
Classifications of oil and gas accumulations on the basis of size
b
a
Accumulation category Oil reserves (MMT ) Gas reserves (BCM )
United States
A 46.85 48.5
B 3.42–6.85 4.2–8.5
C 1.37–3.42 1.7–4.2
D 0.14–1.37 0.2–1.7
E o0.14 o0.2
F Non-commercial
Russia
Unique 4300 4500
Large 300–30 500–30
Medium 30–10 30–10
Small o10 o10
a
MMT ¼ million tons.
b
BCM ¼ billion cubic meters.
TABLE 10.2
Classification of oil and gas accumulations on the basis of production rate
Class Accumulation category Production rate
b
a
Oil (TD ) Gas (CMD )
1 High rate 4100 41,000,000
2 Medium rate 10–100 100,000–1,000,000
3 Low rate 2–10 20,000 – 100,000
4 Non-commercial o2 o20,000
a
TD ¼ tons/day.
b 3
CMD ¼ m /day.
10.2. CLASSIFICATION OF HYDROCARBON ACCUMULATIONS BASED ON PHASE
RELATIONSHIPS
An important factor in the qualitative characterization of an accumulation is the
phase relationships of the fluids present. This is more complicated, however, than
just the identification of liquid (oil) and gaseous (gas) phases.
10.2.1. Gas accumulations
Free gas accumulations containing only C 1 –C 4 hydrocarbons are rare and en-
countered at shallow depths. As mentioned in Chapter 6, as the temperature and