
Page 261 - Geology and Geochemistry of Oil and Gas
P. 261
226 MATHEMATICAL MODELING IN PETROLEUM GEOLOGY
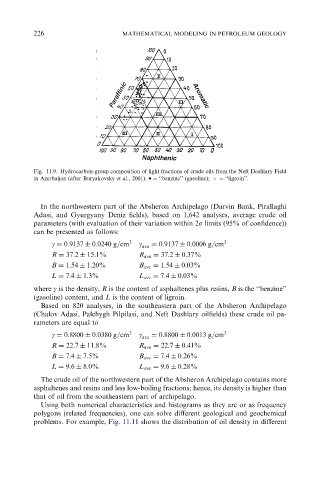
Fig. 11.9. Hydrocarbon-group composition of light fractions of crude oils from the Neft Dashlary Field
in Azerbaijan (after Buryakovsky et al., 2001). ¼ ‘‘benzine’’ (gasoline); ¼ ‘‘ligroin’’.
In the northwestern part of the Absheron Archipelago (Darvin Bank, Pirallaghi
Adasi, and Gyurgyany Deniz fields), based on 1,642 analyses, average crude oil
parameters (with evaluation of their variation within 2s limits (95% of confidence))
can be presented as follows:
g ¼ 0:9137 0:0240 g=cm 3 g ave ¼ 0:9137 0:0006 g=cm 3
R ¼ 37:2 15:1% R ave ¼ 37:2 0:37%
B ¼ 1:54 1:20% B ave ¼ 1:54 0:03%
L ¼ 7:4 1:3% L ave ¼ 7:4 0:03%
where g is the density, R is the content of asphaltenes plus resins, B is the ‘‘benzine’’
(gasoline) content, and L is the content of ligroin.
Based on 820 analyses, in the southeastern part of the Absheron Archipelago
(Chalov Adasi, Palchygh Pilpilasi, and Neft Dashlary oilfields) these crude oil pa-
rameters are equal to
g ¼ 0:8800 0:0380 g=cm 3 g ¼ 0:8800 0:0013 g=cm 3
ave
R ¼ 22:7 11:8% R ave ¼ 22:7 0:41%
B ¼ 7:4 7:5% B ave ¼ 7:4 0:26%
L ¼ 9:6 8:0% L ave ¼ 9:6 0:28%
The crude oil of the northwestern part of the Absheron Archipelago contains more
asphaltenes and resins and less low-boiling fractions; hence, its density is higher than
that of oil from the southeastern part of archipelago.
Using both numerical characteristics and histograms as they are or as frequency
polygons (related frequencies), one can solve different geological and geochemical
problems. For example, Fig. 11.11 shows the distribution of oil density in different