
Page 266 - Geology and Geochemistry of Oil and Gas
P. 266
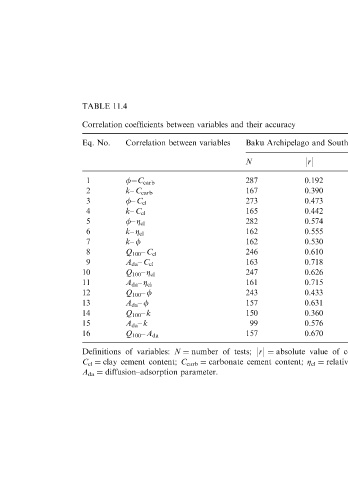
TABLE 11.4                                                                                                    MODELS
                                                                                                                               OF
                 Correlation coefficients between variables and their accuracy                                                  STATIC
                 Eq. No.  Correlation between variables  Baku Archipelago and South Apsheron Offshore Zone  Lower Kura Depression
                                                 N           9r9         s r          3s r         N     9r9     s r    3s r

                  1       f C carb               287         0.192       0.057        0.171        524   0.490   0.033  0.099  GEOLOGIC
                  2       k– C carb              167         0.390       0.060        0.180        254   0.510   0.016  0.140
                  3       f– C cl                273         0.473       0.047        0.141        430   0.228   0.046  0.133
                  4       k– C cl                165         0.442       0.063        0.189        198   0.131   0.062  0.186
                  5       f– Z cl                282         0.574       0.040        0.120        532   0.541   0.031  0.093  SYSTEMS
                  6       k– Z cl                162         0.555       0.054        0.162        237   0.570   0.044  0.132
                  7       k– f                   162         0.530       0.057        0.171        252   0.715   0.031  0.093
                  8       Q 100 – C cl           246         0.610       0.040        0.120        284   0.522   0.043  0.129
                  9       A da – C cl            163         0.718       0.038        0.114        199   0.256   0.066  0.198
                 10       Q 100 – Z cl           247         0.626       0.039        0.117        341   0.400   0.045  0.135
                 11       A da – Z cl            161         0.715       0.039        0.115        252   0.397   0.053  0.159
                 12       Q 100 – f              243         0.433       0.052        0.156        284   0.381   0.051  0.151
                 13       A da – f               157         0.631       0.048        0.144        203   0.418   0.058  0.174
                 14       Q 100 – k              150         0.360       0.071        0.213        151   0.351   0.071  0.213
                 15       A da – k                99         0.576       0.067        0.201        139   0.468   0.066  0.198
                 16       Q 100 – A da           157         0.670       0.044        0.132        169   0.408   0.064  0.192
                 Definitions of variables: N ¼ number of tests; 9r9 ¼ absolute value of correlation coefficient; s r ¼ standard deviation; f ¼ porosity; k ¼ permeability;
                 C cl ¼ clay cement content; C carb ¼ carbonate cement content; Z cl ¼ relative clay content (Z cl ¼ (1– f)C cl /[(1– f)C cl +f]); Q 100 ¼ cation-exchange capacity;
                 A da ¼ diffusion–adsorption parameter.                                                                        231