
Page 268 - Geology and Geochemistry of Oil and Gas
P. 268
232 MATHEMATICAL MODELING IN PETROLEUM GEOLOGY
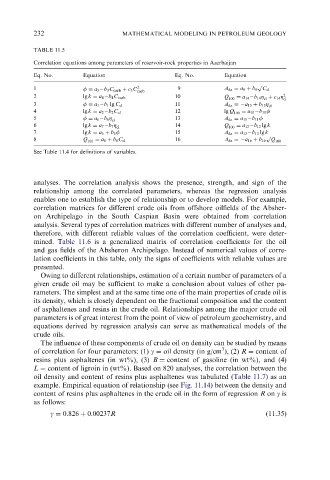
TABLE 11.5
Correlation equations among parameters of reservoir-rock properties in Azerbaijan
Eq. No. Equation Eq. No. Equation
p
1 f ¼ a 3 2b 3 C carb þ c 3 C 2 carb 9 A da ¼ a 9 þ b 9 C cl
2 lg k ¼ a 4 2b 4 C carb 10 Q 100 ¼ a 14 2b 14 Z cl þ c 14 Z 2 cl
3 f ¼ a 1 2b 1 lg C cl 11 A da ¼ 2a 15 þ b 15 Z cl
4 lg k ¼ a 2 2b 2 C cl 12 lg Q 100 ¼ a 10 2b 10 f
5 f ¼ a 6 2b 6 Z cl 13 A da ¼ a 11 2b 11 f
6 lg k ¼ a 7 2b 7 Z cl 14 Q 100 ¼ a 12 2b 12 lg k
7 lg k ¼ a 5 þ b 5 f 15 A da ¼ a 13 2b 13 lg k
p
8 Q 100 ¼ a 8 þ b 8 C cl 16 A da ¼ 2a 16 þ b 16 Q 100
See Table 11.4 for definitions of variables.
analyses. The correlation analysis shows the presence, strength, and sign of the
relationship among the correlated parameters, whereas the regression analysis
enables one to establish the type of relationship or to develop models. For example,
correlation matrices for different crude oils from offshore oilfields of the Absher-
on Archipelago in the South Caspian Basin were obtained from correlation
analysis. Several types of correlation matrices with different number of analyses and,
therefore, with different reliable values of the correlation coefficient, were deter-
mined. Table 11.6 is a generalized matrix of correlation coefficients for the oil
and gas fields of the Absheron Archipelago. Instead of numerical values of corre-
lation coefficients in this table, only the signs of coefficients with reliable values are
presented.
Owing to different relationships, estimation of a certain number of parameters of a
given crude oil may be sufficient to make a conclusion about values of other pa-
rameters. The simplest and at the same time one of the main properties of crude oil is
its density, which is closely dependent on the fractional composition and the content
of asphaltenes and resins in the crude oil. Relationships among the major crude oil
parameters is of great interest from the point of view of petroleum geochemistry, and
equations derived by regression analysis can serve as mathematical models of the
crude oils.
The influence of these components of crude oil on density can be studied by means
3
of correlation for four parameters: (1) g ¼ oil density (in g/cm ), (2) R ¼ content of
resins plus asphaltenes (in wt%), (3) B ¼ content of gasoline (in wt%), and (4)
L ¼ content of ligroin in (wt%). Based on 820 analyses, the correlation between the
oil density and content of resins plus asphaltenes was tabulated (Table 11.7) as an
example. Empirical equation of relationship (see Fig. 11.14) between the density and
content of resins plus asphaltenes in the crude oil in the form of regression R on g is
as follows:
g ¼ 0:826 þ 0:00237R (11.35)