
Page 263 - Geology and Geochemistry of Oil and Gas
P. 263
228 MATHEMATICAL MODELING IN PETROLEUM GEOLOGY
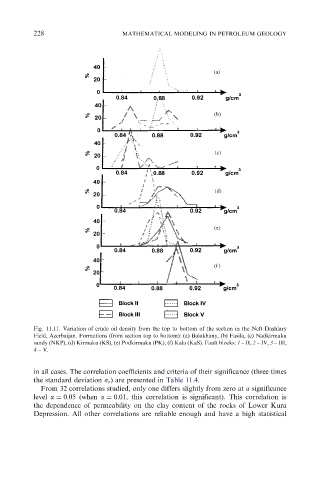
Fig. 11.11. Variation of crude oil density from the top to bottom of the section in the Neft Dashlary
Field, Azerbaijan. Formations (from section top to bottom): (a) Balakhany, (b) Fasila, (c) Nadkirmaku
sandy (NKP), (d) Kirmaku (KS), (e) Podkirmaku (PK), (f) Kala (KaS). Fault blocks: 1 – II, 2 – IV, 3 – III,
4 – V.
in all cases. The correlation coefficients and criteria of their significance (three times
the standard deviation s r ) are presented in Table 11.4.
From 32 correlations studied, only one differs slightly from zero at a significance
level a ¼ 0:05 (when a ¼ 0:01, this correlation is significant). This correlation is
the dependence of permeability on the clay content of the rocks of Lower Kura
Depression. All other correlations are reliable enough and have a high statistical