
Page 272 - Geology and Geochemistry of Oil and Gas
P. 272
MODELS OF STATIC GEOLOGIC SYSTEMS 235
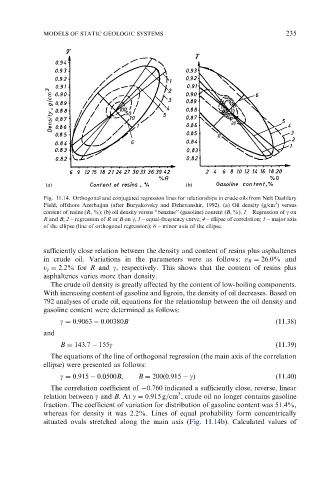
Fig. 11.14. Orthogonal and conjugated regression lines for relationships in crude oils from Neft Dashlary
3
Field, offshore Azerbaijan (after Buryakovsky and Dzhevanshir, 1992). (a) Oil density (g/cm ) versus
content of resins (R, %); (b) oil density versus ‘‘benzine’’ (gasoline) content (B, %). 1 – Regression of g on
R and B; 2 – regression of R or B on g, 3 – equal-frequency curve; 4 – ellipse of correlation; 5 – major axis
of the ellipse (line of orthogonal regression); 6 – minor axis of the ellipse.
sufficiently close relation between the density and content of resins plus asphaltenes
in crude oil. Variations in the parameters were as follows: v R ¼ 26:0% and
v g ¼ 2:2% for R and g, respectively. This shows that the content of resins plus
asphaltenes varies more than density.
The crude oil density is greatly affected by the content of low-boiling components.
With increasing content of gasoline and ligroin, the density of oil decreases. Based on
792 analyses of crude oil, equations for the relationship between the oil density and
gasoline content were determined as follows:
g ¼ 0:9063 0:00380B (11.38)
and
B ¼ 143:7 155g (11.39)
The equations of the line of orthogonal regression (the main axis of the correlation
ellipse) were presented as follows:
g ¼ 0:915 0:0500B; B ¼ 200ð0:915 gÞ (11.40)
The correlation coefficient of 0.760 indicated a sufficiently close, reverse, linear
3
relation between g and B. At g ¼ 0:915 g=cm , crude oil no longer contains gasoline
fraction. The coefficient of variation for distribution of gasoline content was 51.4%,
whereas for density it was 2.2%. Lines of equal probability form concentrically
situated ovals stretched along the main axis (Fig. 11.14b). Calculated values of