
Page 271 - Geology and Geochemistry of Oil and Gas
P. 271
234 MATHEMATICAL MODELING IN PETROLEUM GEOLOGY
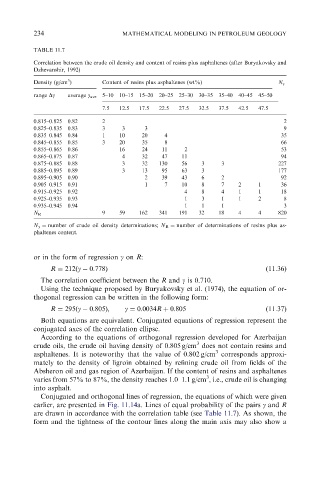
TABLE 11.7
Correlation between the crude oil density and content of resins plus asphaltenes (after Buryakovsky and
Dzhevanshir, 1992)
3
Density (g/cm ) Content of resins plus asphaltenes (wt%) N g
range Dg average g ave 5–10 10–15 15–20 20–25 25–30 30–35 35–40 40–45 45–50
7.5 12.5 17.5 22.5 27.5 32.5 37.5 42.5 47.5
0.815–0.825 0.82 2 2
0.825–0.835 0.83 3 3 3 9
0.835–0.845 0.84 1 10 20 4 35
0.845–0.855 0.85 3 20 35 8 66
0.855–0.865 0.86 16 24 11 2 53
0.865–0.875 0.87 4 32 47 11 94
0.875–0.885 0.88 3 32 130 56 3 3 227
0.885–0.895 0.89 3 13 95 63 3 177
0.895–0.905 0.90 2 39 43 6 2 92
0.905–0.915 0.91 1 7 10 8 7 2 1 36
0.915–0.925 0.92 4 8 4 1 1 18
0.925–0.935 0.93 1 3 1 1 2 8
0.935–0.945 0.94 1 1 1 3
N R 9 59 162 341 191 32 18 4 4 820
N g ¼ number of crude oil density determinations; N R ¼ number of determinations of resins plus as-
phaltenes content.
or in the form of regression g on R:
R ¼ 212ðg 0:778Þ (11.36)
The correlation coefficient between the R and g is 0.710.
Using the technique proposed by Buryakovsky et al. (1974), the equation of or-
thogonal regression can be written in the following form:
R ¼ 295ðg 0:805Þ; g ¼ 0:0034R þ 0:805 (11.37)
Both equations are equivalent. Conjugated equations of regression represent the
conjugated axes of the correlation ellipse.
According to the equations of orthogonal regression developed for Azerbaijan
3
crude oils, the crude oil having density of 0.805 g/cm does not contain resins and
3
asphaltenes. It is noteworthy that the value of 0.802 g/cm corresponds approxi-
mately to the density of ligroin obtained by refining crude oil from fields of the
Absheron oil and gas region of Azerbaijan. If the content of resins and asphaltenes
3
varies from 57% to 87%, the density reaches 1.0–1.1 g/cm , i.e., crude oil is changing
into asphalt.
Conjugated and orthogonal lines of regression, the equations of which were given
earlier, are presented in Fig. 11.14a. Lines of equal probability of the pairs g and R
are drawn in accordance with the correlation table (see Table 11.7). As shown, the
form and the tightness of the contour lines along the main axis may also show a