
Page 279 - Geology and Geochemistry of Oil and Gas
P. 279
242 MATHEMATICAL MODELING IN PETROLEUM GEOLOGY
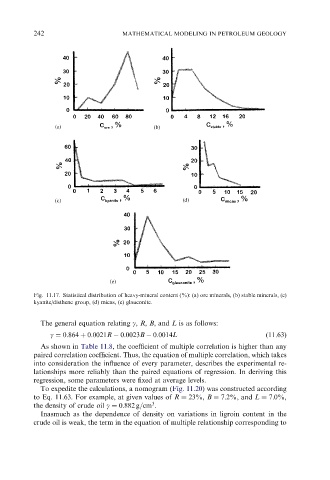
Fig. 11.17. Statistical distribution of heavy-mineral content (%): (a) ore minerals, (b) stable minerals, (c)
kyanite/disthene group, (d) micas, (e) glauconite.
The general equation relating g, R, B, and L is as follows:
g ¼ 0:864 þ 0:0021R 0:0023B 0:0014L (11.63)
As shown in Table 11.8, the coefficient of multiple correlation is higher than any
paired correlation coefficient. Thus, the equation of multiple correlation, which takes
into consideration the influence of every parameter, describes the experimental re-
lationships more reliably than the paired equations of regression. In deriving this
regression, some parameters were fixed at average levels.
To expedite the calculations, a nomogram (Fig. 11.20) was constructed according
to Eq. 11.63. For example, at given values of R ¼ 23%, B ¼ 7:2%, and L ¼ 7:0%,
3
the density of crude oil g ¼ 0:882 g=cm .
Inasmuch as the dependence of density on variations in ligroin content in the
crude oil is weak, the term in the equation of multiple relationship corresponding to