
Page 281 - Geology and Geochemistry of Oil and Gas
P. 281
244 MATHEMATICAL MODELING IN PETROLEUM GEOLOGY
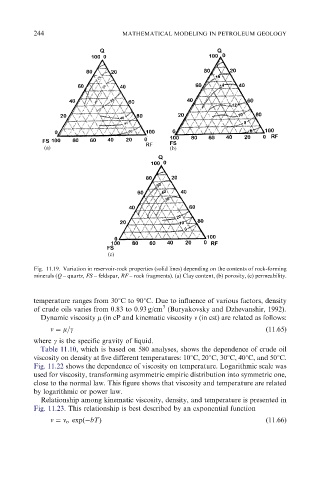
Fig. 11.19. Variation in reservoir-rock properties (solid lines) depending on the contents of rock-forming
minerals (Q – quartz, FS – feldspar, RF – rock fragments). (a) Clay content, (b) porosity, (c) permeability.
temperature ranges from 301C to 901C. Due to influence of various factors, density
3
of crude oils varies from 0.83 to 0.93 g/cm (Buryakovsky and Dzhevanshir, 1992).
Dynamic viscosity m (in cP and kinematic viscosity n (in cst) are related as follows:
n ¼ m=g (11.65)
where g is the specific gravity of liquid.
Table 11.10, which is based on 580 analyses, shows the dependence of crude oil
viscosity on density at five different temperatures: 101C, 201C, 301C, 401C, and 501C.
Fig. 11.22 shows the dependence of viscosity on temperature. Logarithmic scale was
used for viscosity, transforming asymmetric empiric distribution into symmetric one,
close to the normal law. This figure shows that viscosity and temperature are related
by logarithmic or power law.
Relationship among kinematic viscosity, density, and temperature is presented in
Fig. 11.23. This relationship is best described by an exponential function
n ¼ n o expð bTÞ (11.66)