
Page 293 - Geology and Geochemistry of Oil and Gas
P. 293
MODELS OF DYNAMIC GEOLOGIC SYSTEMS 255
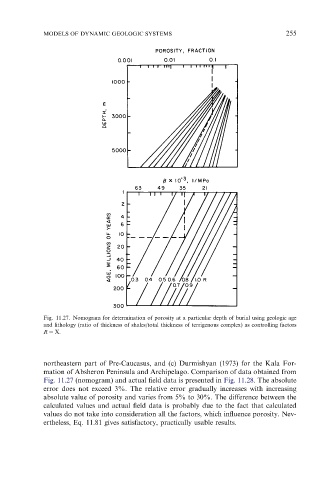
Fig. 11.27. Nomogram for determination of porosity at a particular depth of burial using geologic age
and lithology (ratio of thickness of shales/total thickness of terrigenous complex) as controlling factors
R ¼ X.
northeastern part of Pre-Caucasus, and (c) Durmishyan (1973) for the Kala For-
mation of Absheron Peninsula and Archipelago. Comparison of data obtained from
Fig. 11.27 (nomogram) and actual field data is presented in Fig. 11.28. The absolute
error does not exceed 3%. The relative error gradually increases with increasing
absolute value of porosity and varies from 5% to 30%. The difference between the
calculated values and actual field data is probably due to the fact that calculated
values do not take into consideration all the factors, which influence porosity. Nev-
ertheless, Eq. 11.81 gives satisfactory, practically usable results.