
Page 306 - Geology and Geochemistry of Oil and Gas
P. 306
MODELS OF DYNAMIC GEOLOGIC SYSTEMS 267
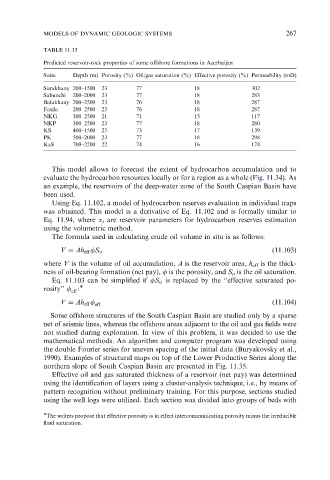
TABLE 11.13
Predicted reservoir-rock properties of some offshore formations in Azerbaijan
Suite Depth (m) Porosity (%) Oil/gas saturation (%) Effective porosity (%) Permeability (mD)
Surakhany 200–1500 23 77 18 302
Sabunchi 200–2000 23 77 18 283
Balakhany 200–2500 23 76 18 287
Fasila 200–2500 23 76 18 287
NKG 300–2500 21 71 15 117
NKP 300–2500 23 77 18 280
KS 400–1500 23 73 17 139
PK 500–2000 23 77 18 298
KaS 700–2200 22 74 16 174
This model allows to forecast the extent of hydrocarbon accumulation and to
evaluate the hydrocarbon resources locally or for a region as a whole (Fig. 11.34). As
an example, the reservoirs of the deep-water zone of the South Caspian Basin have
been used.
Using Eq. 11.102, a model of hydrocarbon reserves evaluation in individual traps
was obtained. This model is a derivative of Eq. 11.102 and is formally similar to
Eq. 11.94, where x i are reservoir parameters for hydrocarbon reserves estimation
using the volumetric method.
The formula used in calculating crude oil volume in situ is as follows:
(11.103)
V ¼ Ah eff fS o
where V is the volume of oil accumulation, A is the reservoir area, h eff is the thick-
ness of oil-bearing formation (net pay), f is the porosity, and S o is the oil saturation.
Eq. 11.103 can be simplified if fS o is replaced by the ‘‘effective saturated po-
rosity’’ f :
eff
V ¼ Ah eff f eff (11.104)
Some offshore structures of the South Caspian Basin are studied only by a sparse
net of seismic lines, whereas the offshore areas adjacent to the oil and gas fields were
not studied during exploration. In view of this problem, it was decided to use the
mathematical methods. An algorithm and computer program was developed using
the double Fourier series for uneven spacing of the initial data (Buryakovsky et al.,
1990). Examples of structural maps on top of the Lower Productive Series along the
northern slope of South Caspian Basin are presented in Fig. 11.35.
Effective oil and gas saturated thickness of a reservoir (net pay) was determined
using the identification of layers using a cluster-analysis technique, i.e., by means of
pattern recognition without preliminary training. For this purpose, sections studied
using the well logs were utilized. Each section was divided into groups of beds with
The writers propose that effective porosity is in effect intercommunicating porosity minus the irreducible
fluid saturation.