
Page 310 - Geology and Geochemistry of Oil and Gas
P. 310
MODELS OF DYNAMIC GEOLOGIC SYSTEMS 271
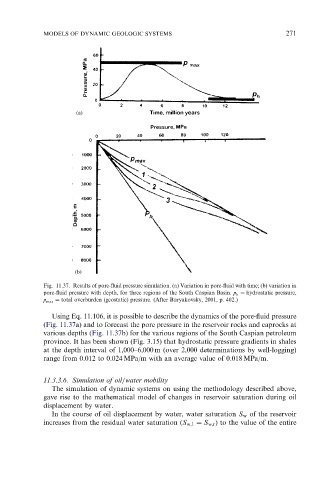
Fig. 11.37. Results of pore-fluid pressure simulation. (a) Variation in pore-fluid with time; (b) variation in
pore-fluid pressure with depth, for three regions of the South Caspian Basin. p h ¼ hydrostatic pressure,
p max ¼ total overburden (geostatic) pressure. (After Buryakovsky, 2001, p. 402.)
Using Eq. 11.106, it is possible to describe the dynamics of the pore-fluid pressure
(Fig. 11.37a) and to forecast the pore pressure in the reservoir rocks and caprocks at
various depths (Fig. 11.37b) for the various regions of the South Caspian petroleum
province. It has been shown (Fig. 3.15) that hydrostatic pressure gradients in shales
at the depth interval of 1,000–6,000 m (over 2,000 determinations by well-logging)
range from 0.012 to 0.024 MPa/m with an average value of 0.018 MPa/m.
11.3.3.6. Simulation of oil/water mobility
The simulation of dynamic systems on using the methodology described above,
gave rise to the mathematical model of changes in reservoir saturation during oil
displacement by water.
In the course of oil displacement by water, water saturation S w of the reservoir
increases from the residual water saturation (S w;1 ¼ S w;r ) to the value of the entire