Page 289 - HVAC Pump Handbook
P. 289

Rishel_CH10.qxd  21/4/06  6:20 PM  Page 286


                                   Basics of Pump Application for HVAC Systems

                       150
                                                     Pump flow–head curves
                                           One pump
                                   40
                                       50  60          Two pumps
                              40    70        70  75
                       125      50  60                 80
                                     75    84             84
                                        80                      87
                                             87
                                   Q 1 –h 1
                                   points      87                   87
                       100                                              84
                                                 84  80                     80
                      Pump head—ft.  75             75  70                     75  70

                        50
                                                    Two pumps
                                                    System head curves
                        25
                                           One pump
                                     Q 2 –h 2  points
                         0
                          0     500   1000   1500   2000   2500   3000   3500   4000
                                            Pumping system flow—GPM
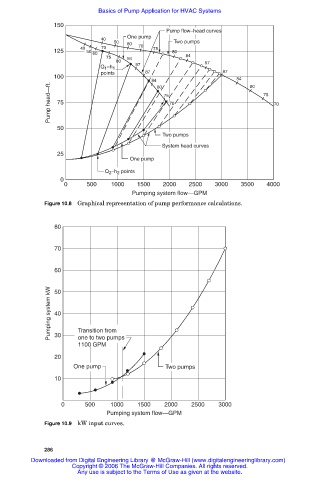
                    Figure 10.8 Graphical representation of pump performance calculations.


                       80


                       70

                       60

                      Pumping system kW  50


                       40

                             Transition from
                       30
                             one to two pumps
                             1100 GPM
                       20
                            One pump                 Two pumps
                       10


                         0     500    1000   1500    2000   2500   3000
                                     Pumping system flow—GPM
                    Figure 10.9 kW input curves.


                    286
                 Downloaded from Digital Engineering Library @ McGraw-Hill (www.digitalengineeringlibrary.com)
                            Copyright © 2006 The McGraw-Hill Companies. All rights reserved.
                             Any use is subject to the Terms of Use as given at the website.
   284   285   286   287   288   289   290   291   292   293   294