
Page 162 - Handbook Of Multiphase Flow Assurance
P. 162
158 5. Flow restrictions and blockages in operations
FIG. 5.30 Illustration of paraffin wax crystal with normal paraffin molecules organized together.
Molecules of various size crystallize as their crystallization temperature is reached. Largest
n-paraffins crystallize at higher temperatures, and usually determine the measurable param-
eter called the wax appearance temperature. The parameter is subjective and depends on the
laboratory's ability to detect the crystallization either by light, heat, force or pressure. Some
objectivity is added because modern laboratory equipment has relatively comparable sensi-
tivity levels.
There are several mechanisms for deposition of paraffins on walls of pipe or well tubing:
thermal and Brownian diffusion, and shear dispersion and settling. The most common one is
thermal diffusion. Paraffins will not deposit if temperature is above crystallization tempera-
ture. Paraffins will have almost no deposition on a pipe wall if there is no temperature differ-
ence between pipe wall and bulk oil because there is no driving force for paraffin molecules
to move toward the pipe wall. Normal paraffin molecules are usually driven from solution
in oil toward the pipe wall by the concentration difference in laminar flow and by turbulent
eddies in turbulent flow. When molecules reach the laminar sublayer, the diffusion mecha-
nism starts.
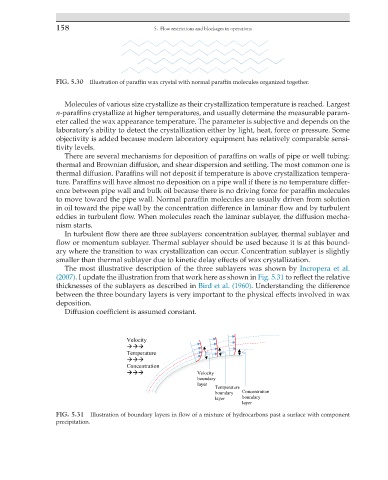
In turbulent flow there are three sublayers: concentration sublayer, thermal sublayer and
flow or momentum sublayer. Thermal sublayer should be used because it is at this bound-
ary where the transition to wax crystallization can occur. Concentration sublayer is slightly
smaller than thermal sublayer due to kinetic delay effects of wax crystallization.
The most illustrative description of the three sublayers was shown by Incropera et al.
(2007). I update the illustration from that work here as shown in Fig. 5.31 to reflect the relative
thicknesses of the sublayers as described in Bird et al. (1960). Understanding the difference
between the three boundary layers is very important to the physical effects involved in wax
deposition.
Diffusion coefficient is assumed constant.
Velocity
Temperature
Concentration
Velocity
boundary
layer
Temperature
boundary Concentration
layer boundary
layer
FIG. 5.31 Illustration of boundary layers in flow of a mixture of hydrocarbons past a surface with component
precipitation.