
Page 292 - Handbook Of Multiphase Flow Assurance
P. 292
Experimental and computer study of the effect of kinetic inhibitors on clathrate hydrates 291
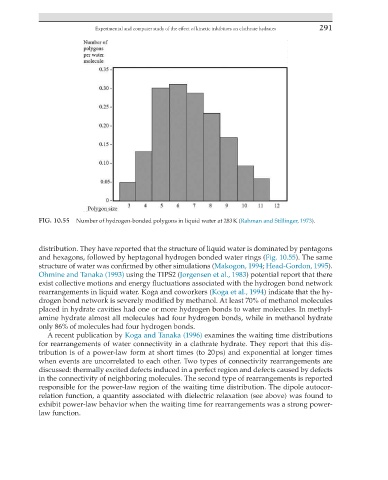
FIG. 10.55 Number of hydrogen-bonded polygons in liquid water at 283 K (Rahman and Stillinger, 1973).
distribution. They have reported that the structure of liquid water is dominated by pentagons
and hexagons, followed by heptagonal hydrogen bonded water rings (Fig. 10.55). The same
structure of water was confirmed by other simulations (Makogon, 1994; Head-Gordon, 1995).
Ohmine and Tanaka (1993) using the TIPS2 (Jorgensen et al., 1983) potential report that there
exist collective motions and energy fluctuations associated with the hydrogen bond network
rearrangements in liquid water. Koga and coworkers (Koga et al., 1994) indicate that the hy-
drogen bond network is severely modified by methanol. At least 70% of methanol molecules
placed in hydrate cavities had one or more hydrogen bonds to water molecules. In methyl-
amine hydrate almost all molecules had four hydrogen bonds, while in methanol hydrate
only 86% of molecules had four hydrogen bonds.
A recent publication by Koga and Tanaka (1996) examines the waiting time distributions
for rearrangements of water connectivity in a clathrate hydrate. They report that this dis-
tribution is of a power-law form at short times (to 20 ps) and exponential at longer times
when events are uncorrelated to each other. Two types of connectivity rearrangements are
discussed: thermally excited defects induced in a perfect region and defects caused by defects
in the connectivity of neighboring molecules. The second type of rearrangements is reported
responsible for the power-law region of the waiting time distribution. The dipole autocor-
relation function, a quantity associated with dielectric relaxation (see above) was found to
exhibit power-law behavior when the waiting time for rearrangements was a strong power-
law function.