
Page 134 - Handbook of Thermal Analysis of Construction Materials
P. 134
Section 7.0 - Portland Cement 117
cement made at different water:cement ratios indicates that the first intense
inflection occurs much earlier in the supersulfated cement. [63] The high
strength of supersulfated cement is due to the dense structure of ettringite
produced at early times of hydration.
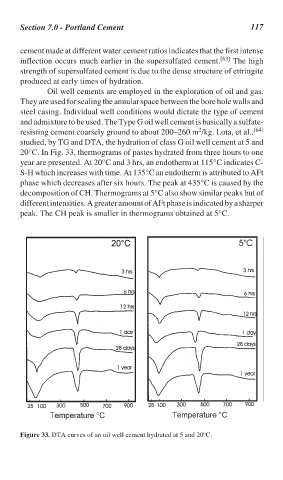
Oil well cements are employed in the exploration of oil and gas.
They are used for sealing the annular space between the bore hole walls and
steel casing. Individual well conditions would dictate the type of cement
and admixture to be used. The Type G oil well cement is basically a sulfate-
2
resisting cement coarsely ground to about 200–260 m /kg. Lota, et al., [64]
studied, by TG and DTA, the hydration of class G oil well cement at 5 and
20°C. In Fig. 33, thermograms of pastes hydrated from three hours to one
year are presented. At 20°C and 3 hrs, an endotherm at 115°C indicates C-
S-H which increases with time. At 135°C an endotherm is attributed to AFt
phase which decreases after six hours. The peak at 435°C is caused by the
decomposition of CH. Thermograms at 5°C also show similar peaks but of
different intensities. A greater amount of AFt phase is indicated by a sharper
peak. The CH peak is smaller in thermograms obtained at 5°C.
o
Figure 33. DTA curves of an oil well cement hydrated at 5 and 20 C.