
Page 90 - Handbook of Adhesives and Sealants
P. 90
58 Chapter Two
Transition Cohesive Plateau
Region
C
Boundary
Failure Region
Adhesive
Joint
Strength
B /C
B
Tenacity of Surface Attachment
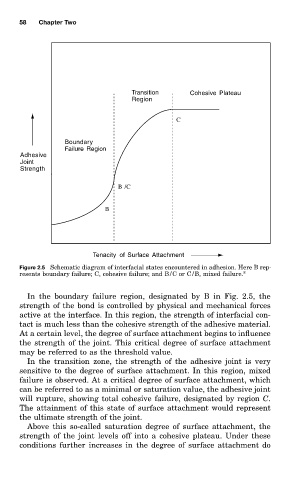
Figure 2.5 Schematic diagram of interfacial states encountered in adhesion. Here B rep-
resents boundary failure; C, cohesive failure; and B/C or C/B, mixed failure. 8
In the boundary failure region, designated by B in Fig. 2.5, the
strength of the bond is controlled by physical and mechanical forces
active at the interface. In this region, the strength of interfacial con-
tact is much less than the cohesive strength of the adhesive material.
At a certain level, the degree of surface attachment begins to influence
the strength of the joint. This critical degree of surface attachment
may be referred to as the threshold value.
In the transition zone, the strength of the adhesive joint is very
sensitive to the degree of surface attachment. In this region, mixed
failure is observed. At a critical degree of surface attachment, which
can be referred to as a minimal or saturation value, the adhesive joint
will rupture, showing total cohesive failure, designated by region C.
The attainment of this state of surface attachment would represent
the ultimate strength of the joint.
Above this so-called saturation degree of surface attachment, the
strength of the joint levels off into a cohesive plateau. Under these
conditions further increases in the degree of surface attachment do