
Page 271 - Handbook of Battery Materials
P. 271
9.2 Theory and Basic Principles 241
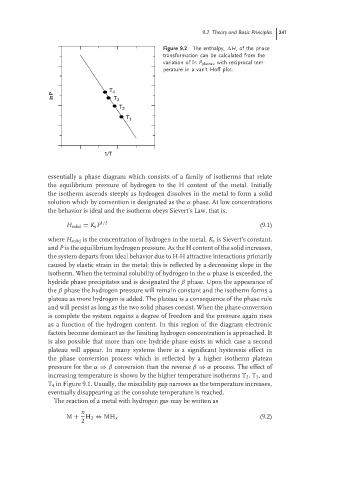
Figure 9.2 The enthalpy, H, of the phase
transformation can be calculated from the
variation of ln P plateau with reciprocal tem-
perature in a van’t Hoff plot.
T 4
lnP T 3
T 2
T 1
1/T
essentially a phase diagram which consists of a family of isotherms that relate
the equilibrium pressure of hydrogen to the H content of the metal. Initially
the isotherm ascends steeply as hydrogen dissolves in the metal to form a solid
solution which by convention is designated as the α phase. At low concentrations
the behavior is ideal and the isotherm obeys Sievert’s Law, that is,
H solid = K s P 1/2 (9.1)
where H solid is the concentration of hydrogen in the metal, K s is Sievert’s constant,
and P is the equilibrium hydrogen pressure. As the H content of the solid increases,
the system departs from ideal behavior due to H-H attractive interactions primarily
caused by elastic strain in the metal; this is reflected by a decreasing slope in the
isotherm. When the terminal solubility of hydrogen in the α phase is exceeded, the
hydride phase precipitates and is designated the β phase. Upon the appearance of
the β phase the hydrogen pressure will remain constant and the isotherm forms a
plateau as more hydrogen is added. The plateau is a consequence of the phase rule
and will persist as long as the two solid phases coexist. When the phase conversion
is complete the system regains a degree of freedom and the pressure again rises
as a function of the hydrogen content. In this region of the diagram electronic
factors become dominant as the limiting hydrogen concentration is approached. It
is also possible that more than one hydride phase exists in which case a second
plateau will appear. In many systems there is a significant hysteresis effect in
the phase conversion process which is reflected by a higher isotherm plateau
pressure for the α ⇒ β conversion than the reverse β ⇒ α process. The effect of
increasing temperature is shown by the higher temperature isotherms T 2 ,T 3 , and
T 4 in Figure 9.1. Usually, the miscibility gap narrows as the temperature increases,
eventually disappearing as the consolute temperature is reached.
The reaction of a metal with hydrogen gas may be written as
x
M + H 2 ⇔ MH x (9.2)
2