
Page 539 - Handbook of Battery Materials
P. 539
512 16 The Anode/Electrolyte Interface
B
PE or CPE
1
A
Lithium Void
L V
(C)
L SEI
(D)
2
A Void
(C)
L SEI
3
50 nm
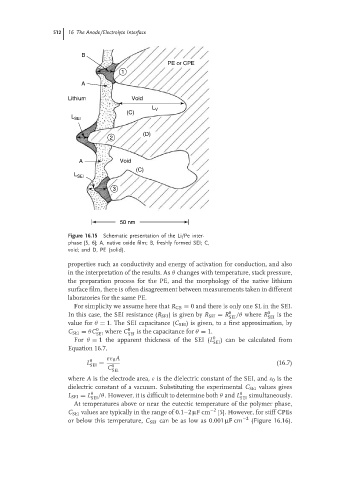
Figure 16.15 Schematic presentation of the Li/Pe inter-
phase [5, 6]; A, native oxide film; B, freshly formed SEI; C,
void; and D, PE (solid).
properties such as conductivity and energy of activation for conduction, and also
in the interpretation of the results. As θ changes with temperature, stack pressure,
the preparation process for the PE, and the morphology of the native lithium
surface film, there is often disagreement between measurements taken in different
laboratories for the same PE.
For simplicity we assume here that R GB = 0 and there is only one SL in the SEI.
In this case, the SEI resistance (R SEI ) is given by R SEI = R 0 /θ where R 0 is the
SEI SEI
value for θ = 1. The SEI capacitance (C SEI ) is given, to a first approximation, by
C SEI = θC 0 where C 0 is the capacitance for θ = 1.
SEI SEI
For θ = 1 the apparent thickness of the SEI (L 0 ) can be calculated from
SEI
Equation 16.7,
εε 0 A
L 0 = (16.7)
SEI 0
C
SEI
where A is the electrode area, ε is the dielectric constant of the SEI, and ε 0 is the
dielectric constant of a vacuum. Substituting the experimental C SEI values gives
L SEI = L 0 SEI /θ. However, it is difficult to determine both θ and L 0 SEI simultaneously.
At temperatures above or near the eutectic temperature of the polymer phase,
C SEI values are typically in the range of 0.1–2 µFcm −2 [5]. However, for stiff CPEs
or below this temperature, C SEI can be as low as 0.001 µFcm −2 (Figure 16.16).