
Page 624 - Handbook of Battery Materials
P. 624
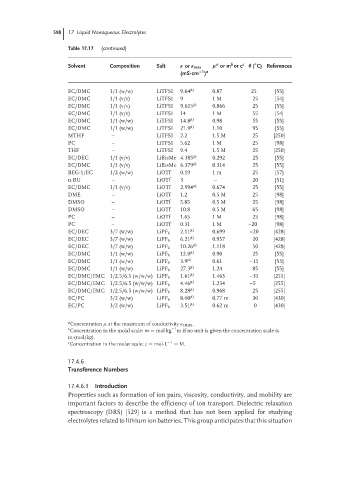
598  17 Liquid Nonaqueous Electrolytes

                    Table 17.17  (continued)

                                                                  b
                                                              a
                                                                         ◦
                    Solvent     Composition  Salt   κ or κ max  µ or m or c c  θ ( C) References
                                                         −1 a
                                                    (mS·cm )
                    EC/DMC      1/1 (w/w)    LiTFSI  9.64 µ)  0.87      25     [55]
                    EC/DMC      1/1 (v/v)    LiTFSI  9       1 M         25    [54]
                    EC/DMC      1/1 (v/v)    LiTFSI  9.615 µ)  0.866     25    [55]
                    EC/DMC      1/1 (v/v)    LiTFSI  14      1 M         55    [54]
                    EC/DMC      1/1 (w/w)    LiTFSI  14.8 µ)  0.98       55    [55]
                    EC/DMC      1/1 (w/w)    LiTFSI  21.9 µ)  1.10       95    [55]
                    MTHF         –           LiTFSI  2.2     1.5 M       25    [250]
                    PC           –           LiTFSI  5.62    1 M         25    [98]
                    THF          –           LiTFSI  9.4     1.5 M       25    [250]
                    EC/DEC      1/1 (v/v)    LiBisMe 4.385 µ)  0.292     25    [55]
                    EC/DMC      1/1 (v/v)    LiBisMe 6.379 µ)  0.314     25    [55]
                    BEG-1/EC    1/2 (w/w)    LiOTf  0.19     1 m         25    [57]
                    n-BU         –           LiOTf  3         –          20    [51]
                    EC/DMC      1/1 (v/v)    LiOTf  2.994 µ)  0.674      25    [55]
                    DME          –           LiOTf  1.2      0.5 M       25    [98]
                    DMSO         –           LiOTf  5.85     0.5 M       25    [98]
                    DMSO         –           LiOTf  10.8     0.5 M       65    [98]
                    PC           –           LiOTf  1.65     1 M         25    [98]
                    PC           –           LiOTf  0.31     1 M       –20     [98]
                    EC/DEC      3/7 (w/w)    LiPF 6  2.11 µ)  0.699     –20    [428]
                    EC/DEC      3/7 (w/w)    LiPF 6  6.21 µ)  0.957      20    [428]
                    EC/DEC      3/7 (w/w)    LiPF 6  10.26 µ)  1.118     50    [428]
                    EC/DMC      1/1 (w/w)    LiPF 6  12.0 µ)  0.90       25    [55]
                    EC/DMC      1/1 (w/w)    LiPF 6  3.9 µ)  0.61       –15    [55]
                    EC/DMC      1/1 (w/w)    LiPF 6  27.3 µ)  1.24       85    [55]
                    EC/DMC/EMC 1/2.5/6.5 (w/w/w) LiPF 6  1.61 µ)  1.463  –35   [255]
                    EC/DMC/EMC 1/2.5/6.5 (w/w/w) LiPF 6  4.46 µ)  1.234  –5    [255]
                    EC/DMC/EMC 1/2.5/6.5 (w/w/w) LiPF 6  8.28 µ)  0.968  25    [255]
                    EC/PC       3/2 (w/w)    LiPF 6  8.00 µ)  0.77 m     30    [430]
                    EC/PC       3/2 (w/w)    LiPF 6  3.51 µ)  0.62 m     0     [430]

                    a
                     Concentration µ at the maximum of conductivity κ max .
                    b Concentration in the molal scale: m = mol·kg −1 m if no unit is given the concentration scale is
                    m·(mol/kg).
                    c Concentration in the molar scale: c = mol·L −1  = M.

                    17.4.6
                    Transference Numbers

                    17.4.6.1 Introduction
                    Properties such as formation of ion pairs, viscosity, conductivity, and mobility are
                    important factors to describe the efficiency of ion transport. Dielectric relaxation
                    spectroscopy (DRS) [529] is a method that has not been applied for studying
                    electrolytes related to lithium ion batteries. This group anticipates that this situation