
Page 123 - Handbook of Biomechatronics
P. 123
Model-Based Control of Biomechatronic Systems 119
young male, young female, old male, and old female, and the EPS charac-
teristic curves are tuned for each driver type. Finally, the performance of the
tuned controller is evaluated using the high-fidelity biomechatronic driver-
vehicle model.
3.4.1 Driver-Specific EPS Characteristic Curves
To study the effect of variation of muscle parameters on the EPS character-
istic curves, the muscle parameters are changed separately and the effect of
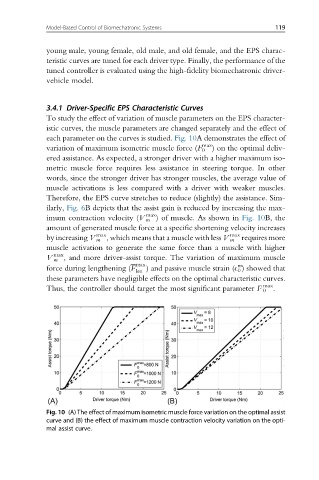
each parameter on the curves is studied. Fig. 10A demonstrates the effect of
max
variation of maximum isometric muscle force (F 0 ) on the optimal deliv-
ered assistance. As expected, a stronger driver with a higher maximum iso-
metric muscle force requires less assistance in steering torque. In other
words, since the stronger driver has stronger muscles, the average value of
muscle activations is less compared with a driver with weaker muscles.
Therefore, the EPS curve stretches to reduce (slightly) the assistance. Sim-
ilarly, Fig. 6B depicts that the assist gain is reduced by increasing the max-
max
imum contraction velocity (V m ) of muscle. As shown in Fig. 10B, the
amount of generated muscle force at a specific shortening velocity increases
max max
by increasing V m , which means that a muscle with less V m requires more
muscle activation to generate the same force than a muscle with higher
max
V m , and more driver-assist torque. The variation of maximum muscle
max m
force during lengthening (F ) and passive muscle strain (E 0 ) showed that
len
these parameters have negligible effects on the optimal characteristic curves.
max
Thus, the controller should target the most significant parameter F 0 .
Fig. 10 (A) The effect of maximum isometric muscle force variation on the optimal assist
curve and (B) the effect of maximum muscle contraction velocity variation on the opti-
mal assist curve.