
Page 126 - Handbook of Biomechatronics
P. 126
122 Naser Mehrabi and John McPhee
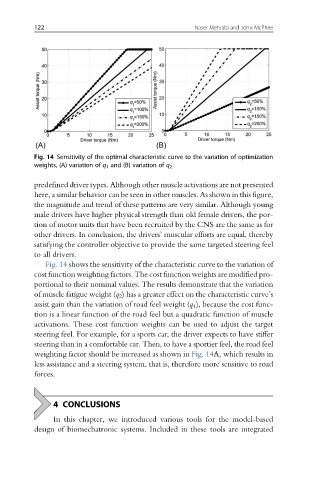
Fig. 14 Sensitivity of the optimal characteristic curve to the variation of optimization
weights, (A) variation of q 1 and (B) variation of q 2.
predefined driver types. Although other muscle activations are not presented
here, a similar behavior can be seen in other muscles. As shown in this figure,
the magnitude and trend of these patterns are very similar. Although young
male drivers have higher physical strength than old female drivers, the por-
tion of motor units that have been recruited by the CNS are the same as for
other drivers. In conclusion, the drivers’ muscular efforts are equal, thereby
satisfying the controller objective to provide the same targeted steering feel
to all drivers.
Fig. 14 shows the sensitivity of the characteristic curve to the variation of
cost function weighting factors. The cost function weights are modified pro-
portional to their nominal values. The results demonstrate that the variation
of muscle fatigue weight (q 2 ) has a greater effect on the characteristic curve’s
assist gain than the variation of road feel weight (q 1 ), because the cost func-
tion is a linear function of the road feel but a quadratic function of muscle
activations. These cost function weights can be used to adjust the target
steering feel. For example, for a sports car, the driver expects to have stiffer
steering than in a comfortable car. Then, to have a sportier feel, the road feel
weighting factor should be increased as shown in Fig. 14A, which results in
less assistance and a steering system, that is, therefore more sensitive to road
forces.
4 CONCLUSIONS
In this chapter, we introduced various tools for the model-based
design of biomechatronic systems. Included in these tools are integrated