
Page 124 - Handbook of Biomechatronics
P. 124
120 Naser Mehrabi and John McPhee
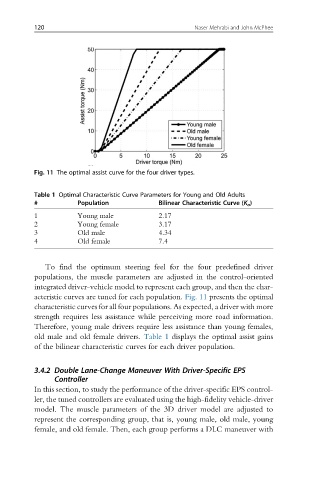
Fig. 11 The optimal assist curve for the four driver types.
Table 1 Optimal Characteristic Curve Parameters for Young and Old Adults
# Population Bilinear Characteristic Curve (K a )
1 Young male 2.17
2 Young female 3.17
3 Old male 4.34
4 Old female 7.4
To find the optimum steering feel for the four predefined driver
populations, the muscle parameters are adjusted in the control-oriented
integrated driver-vehicle model to represent each group, and then the char-
acteristic curves are tuned for each population. Fig. 11 presents the optimal
characteristic curves for all four populations. As expected, a driver with more
strength requires less assistance while perceiving more road information.
Therefore, young male drivers require less assistance than young females,
old male and old female drivers. Table 1 displays the optimal assist gains
of the bilinear characteristic curves for each driver population.
3.4.2 Double Lane-Change Maneuver With Driver-Specific EPS
Controller
In this section, to study the performance of the driver-specific EPS control-
ler, the tuned controllers are evaluated using the high-fidelity vehicle-driver
model. The muscle parameters of the 3D driver model are adjusted to
represent the corresponding group, that is, young male, old male, young
female, and old female. Then, each group performs a DLC maneuver with