
Page 109 - Handbook of Electrical Engineering
P. 109
90 HANDBOOK OF ELECTRICAL ENGINEERING
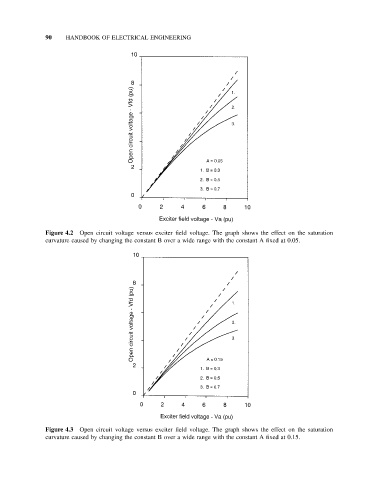
Figure 4.2 Open circuit voltage versus exciter field voltage. The graph shows the effect on the saturation
curvature caused by changing the constant B over a wide range with the constant A fixed at 0.05.
Figure 4.3 Open circuit voltage versus exciter field voltage. The graph shows the effect on the saturation
curvature caused by changing the constant B over a wide range with the constant A fixed at 0.15.