
Page 454 - Handbook of Electrical Engineering
P. 454
COMPUTER BASED POWER MANAGEMENT SYSTEMS 443
• White devices withdrawn from service.
• Yellow devices tripped due to a fault.
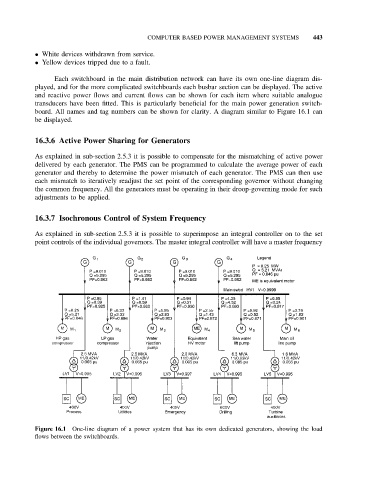
Each switchboard in the main distribution network can have its own one-line diagram dis-
played, and for the more complicated switchboards each busbar section can be displayed. The active
and reactive power flows and current flows can be shown for each item where suitable analogue
transducers have been fitted. This is particularly beneficial for the main power generation switch-
board. All names and tag numbers can be shown for clarity. A diagram similar to Figure 16.1 can
be displayed.
16.3.6 Active Power Sharing for Generators
As explained in sub-section 2.5.3 it is possible to compensate for the mismatching of active power
delivered by each generator. The PMS can be programmed to calculate the average power of each
generator and thereby to determine the power mismatch of each generator. The PMS can then use
each mismatch to iteratively readjust the set point of the corresponding governor without changing
the common frequency. All the generators must be operating in their droop-governing mode for such
adjustments to be applied.
16.3.7 Isochronous Control of System Frequency
As explained in sub-section 2.5.3 it is possible to superimpose an integral controller on to the set
point controls of the individual governors. The master integral controller will have a master frequency
Figure 16.1 One-line diagram of a power system that has its own dedicated generators, showing the load
flows between the switchboards.