
Page 588 - Handbook of Electrical Engineering
P. 588
CALCULATION OF VOLT-DROP IN A CIRCUIT CONTAINING AN INDUCTION MOTOR 581
Table G.1. Motor data for graphical estimation of volt-drop
Motor rating Efficiency Power kVA I s /I n Power kVA at Z ms at
(kW) (per-unit) factor at rating at ratio factor at starting starting
full load full load starting per-unit
315 0.9455 0.8603 387.2 6.787 0.217 2628.3 0.1473
430 0.9537 0.8715 517.4 6.445 0.219 3334.3 0.1552
630 0.9595 0.8780 747.8 5.838 0.208 4365.6 0.1713
720 0.9608 0.8788 852.6 5.619 0.202 4790.9 0.1780
800 0.9617 0.8791 946.3 5.453 0.196 5158.6 0.1834
1,100 0.9638 0.8780 1299.8 5.000 0.179 6498.5 0.2000
1,500 0.9654 0.8756 1774.4 4.661 0.162 8270.0 0.2145
2,500 0.9680 0.8722 2961.0 4.347 0.137 12,872 0.2300
5,000 0.9717 0.8742 5886.6 4.397 0.111 25,883 0.2274
6,300 0.9726 0.8763 7392.3 4.527 0.104 33,461 0.2209
8,000 0.9730 0.8786 9358.1 4.712 0.096 44,093 0.2122
11,000 0.9727 0.8806 12,843 5.017 0.086 64,440 0.1993
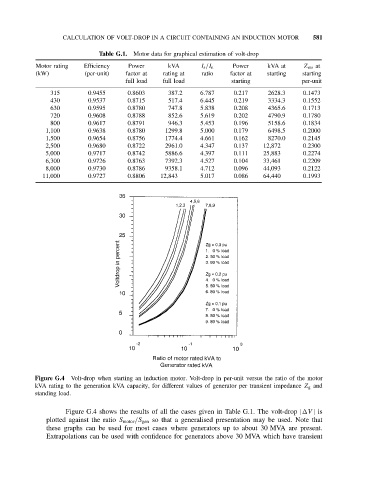
Figure G.4 Volt-drop when starting an induction motor. Volt-drop in per-unit versus the ratio of the motor
kVA rating to the generation kVA capacity, for different values of generator per transient impedance Z g and
standing load.
Figure G.4 shows the results of all the cases given in Table G.1. The volt-drop | V | is
plotted against the ratio S motor /S gen so that a generalised presentation may be used. Note that
these graphs can be used for most cases where generators up to about 30 MVA are present.
Extrapolations can be used with confidence for generators above 30 MVA which have transient