
Page 105 - Handbook of Energy Engineering Calculations
P. 105
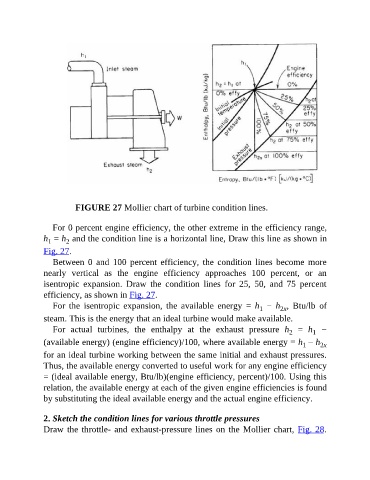
FIGURE 27 Mollier chart of turbine condition lines.

                  For 0 percent engine efficiency, the other extreme in the efficiency range,
               h  = h  and the condition line is a horizontal line, Draw this line as shown in
                       2
                 1
               Fig. 27.
                  Between  0  and  100  percent  efficiency,  the  condition  lines  become  more

               nearly  vertical  as  the  engine  efficiency  approaches  100  percent,  or  an
               isentropic  expansion.  Draw  the  condition  lines  for  25,  50,  and  75  percent
               efficiency, as shown in Fig. 27.
                  For  the  isentropic  expansion,  the  available  energy  =  h   −  h ,  Btu/lb  of
                                                                                              2x
                                                                                       1
               steam. This is the energy that an ideal turbine would make available.
                  For  actual  turbines,  the  enthalpy  at  the  exhaust  pressure  h   =  h   −
                                                                                                 2
                                                                                                        1
               (available energy) (engine efficiency)/100, where available energy = h  – h                 2x
                                                                                                     1
               for an ideal turbine working between the same initial and exhaust pressures.

               Thus, the available energy converted to useful work for any engine efficiency
               = (ideal available energy, Btu/lb)(engine efficiency, percent)/100. Using this
               relation, the available energy at each of the given engine efficiencies is found

               by substituting the ideal available energy and the actual engine efficiency.


               2. Sketch the condition lines for various throttle pressures
               Draw the throttle- and exhaust-pressure lines on the Mollier chart, Fig. 28.