
Page 106 - Handbook of Energy Engineering Calculations
P. 106
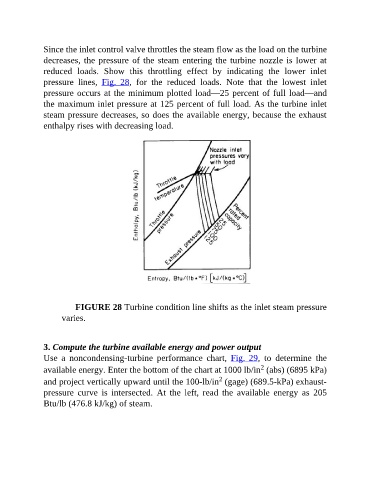
Since the inlet control valve throttles the steam flow as the load on the turbine
               decreases, the pressure of the steam entering the turbine nozzle is lower at
               reduced  loads.  Show  this  throttling  effect  by  indicating  the  lower  inlet
               pressure  lines,  Fig.  28,  for  the  reduced  loads.  Note  that  the  lowest  inlet
               pressure occurs at the minimum plotted load—25 percent of full load—and

               the maximum inlet pressure at 125 percent of full load. As the turbine inlet
               steam pressure decreases, so does the available energy, because the exhaust
               enthalpy rises with decreasing load.


                          FIGURE 28 Turbine condition line shifts as the inlet steam pressure
                     varies.


               3. Compute the turbine available energy and power output
               Use  a  noncondensing-turbine  performance  chart,  Fig.  29,  to  determine  the
                                                                                       2
               available energy. Enter the bottom of the chart at 1000 lb/in  (abs) (6895 kPa)
                                                                         2
               and project vertically upward until the 100-lb/in  (gage) (689.5-kPa) exhaust-
               pressure  curve  is  intersected.  At  the  left,  read  the  available  energy  as  205
               Btu/lb (476.8 kJ/kg) of steam.